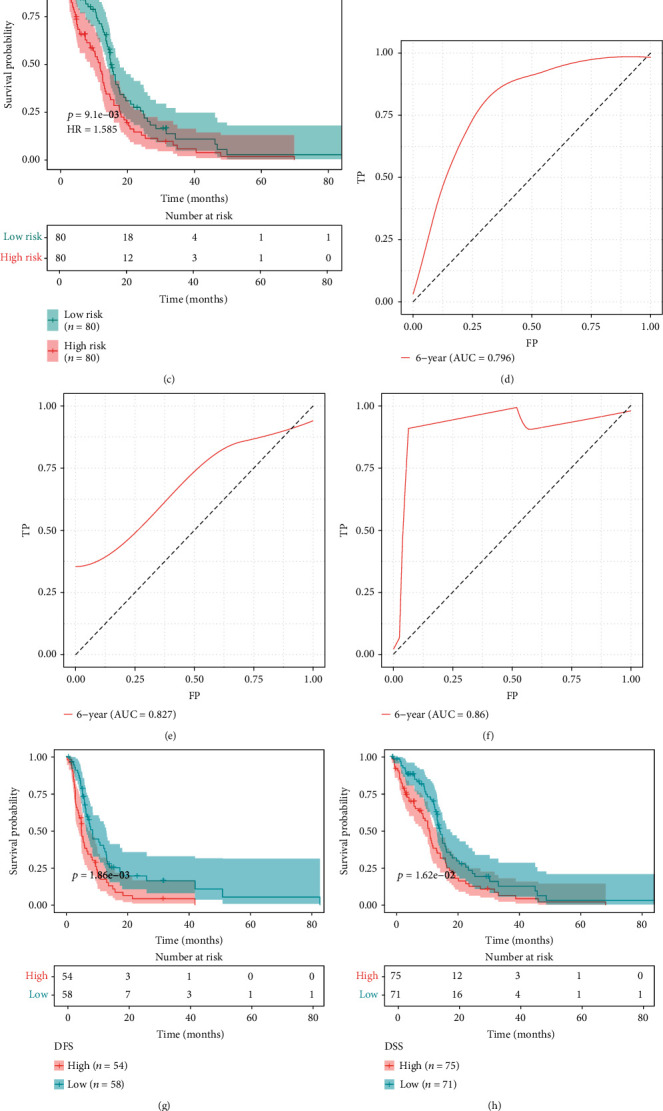
Figure 3.

Hypoxia-derived risk score predicts GBM prognosis, recurrence, and progression in TCGA dataset. (a–c) Kaplan-Meier curves of OS were depicted between high- and low-risk groups in the training set, testing set, and entire set. (d–f) ROC curves of 6-year survival were conducted for estimating the prediction ability of this risk score for GBM prognosis in the training set, testing set, and entire set. (g–i) Kaplan-Meier curves were utilized for comparing the differences in DFS, FSS, and PFS between high- and low-risk groups in TCGA dataset.
