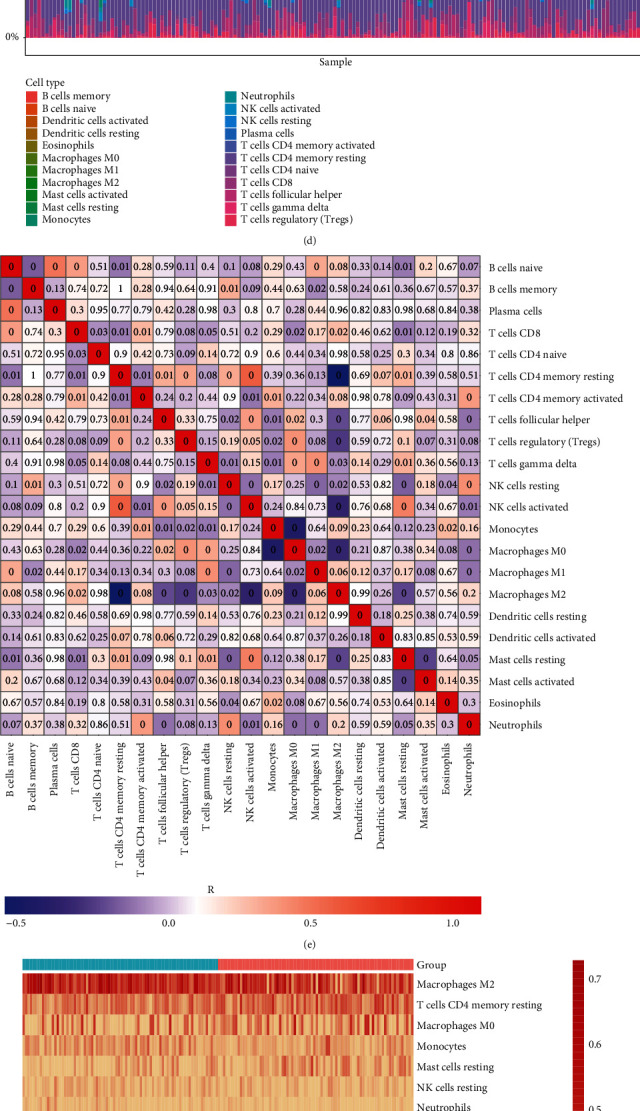
Figure 7.

Association of hypoxia-derived risk score with tumor microenvironment of GBM in TCGA dataset. (a–c) Immune score, stromal score, and ESTIMATE score were compared between high- and low-risk groups. (d) Landscape of the abundance of tumor-infiltrating lymphocytes across GBM tissues. The color of the box indicated the correlation coefficient R. The darker the color, the stronger the correlation. Red represented positive correlation, and blue represented negative correlation. The number in the box represented the P value. “0” meant P < 0.001. (e) Heat map showed the correlations between tumor-infiltrating lymphocytes across GBM tissues. Red meant positive correlation while blue meant negative correlation. (f) Heat map visualized the abundance of tumor-infiltrating lymphocytes in each GBM specimen. (g) The abundance of tumor-infiltrating lymphocytes was compared between high- and low-risk groups.
