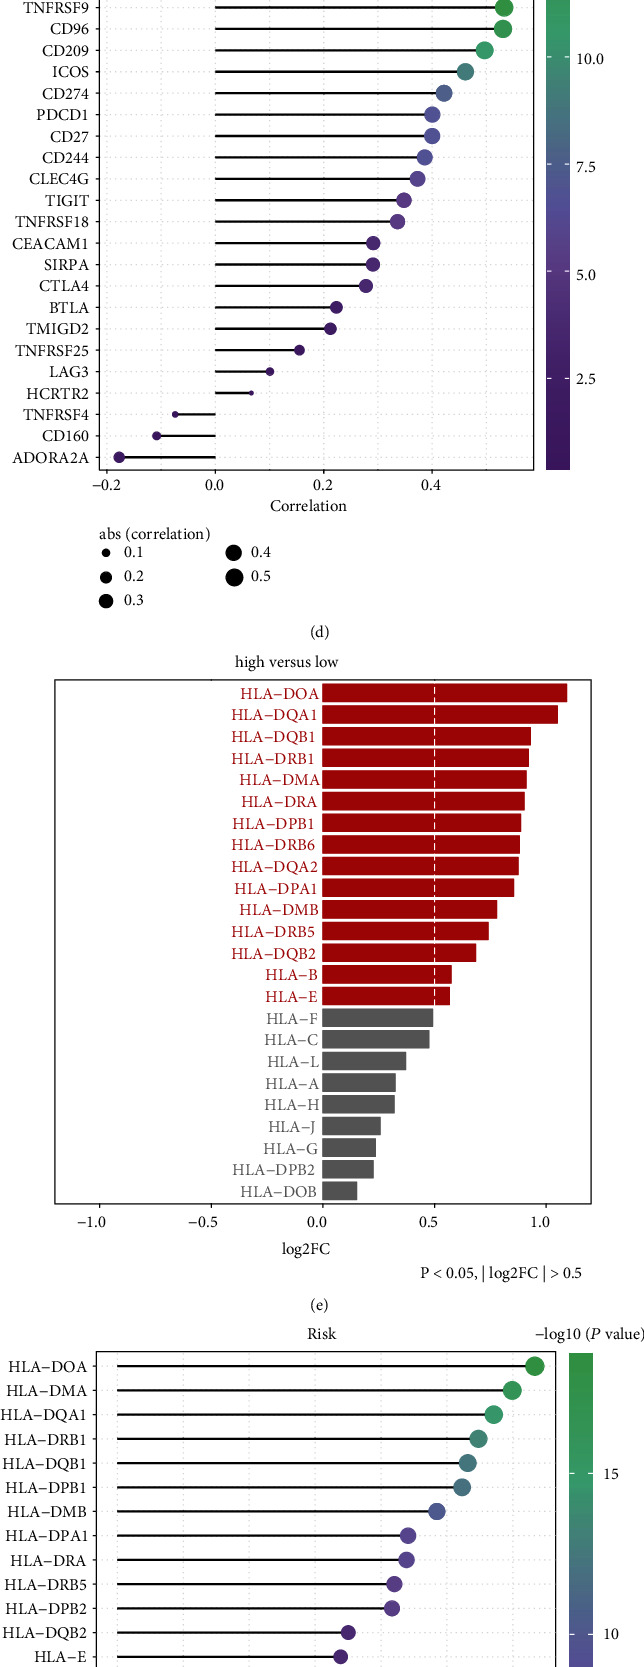
Figure 8.

Hypoxia-derived risk score can predict immune response and chemotherapeutic sensitivity across GBM patients in TCGA dataset. (a) Heat map visualized the activation of each step in cancer immunity cycle in high- and low-risk GBM groups. (b) The activation of each step in cancer immune cycle was compared in high- and low-risk GBM groups. ∗P < 0.05; ∗∗P < 0.01; ∗∗∗P < 0.001. (c) The mRNA expression of immune checkpoints was compared between high- and low-risk GBM groups. (d) Correlation of each immune checkpoint with risk score was calculated across GBM patients. (e) The mRNA expression of HLA genes was compared between high- and low-risk GBM groups. (f) Correlation of each HLA gene with risk score was calculated across GBM patients. (g) Heat map visualized the IPS score in high- and low-risk GBM groups. (h) TIDE score was compared between high- and low-risk GBM groups. (i) IC50 values of chemotherapeutic agents were compared between high- and low-risk GBM groups.
