
Figure 9.
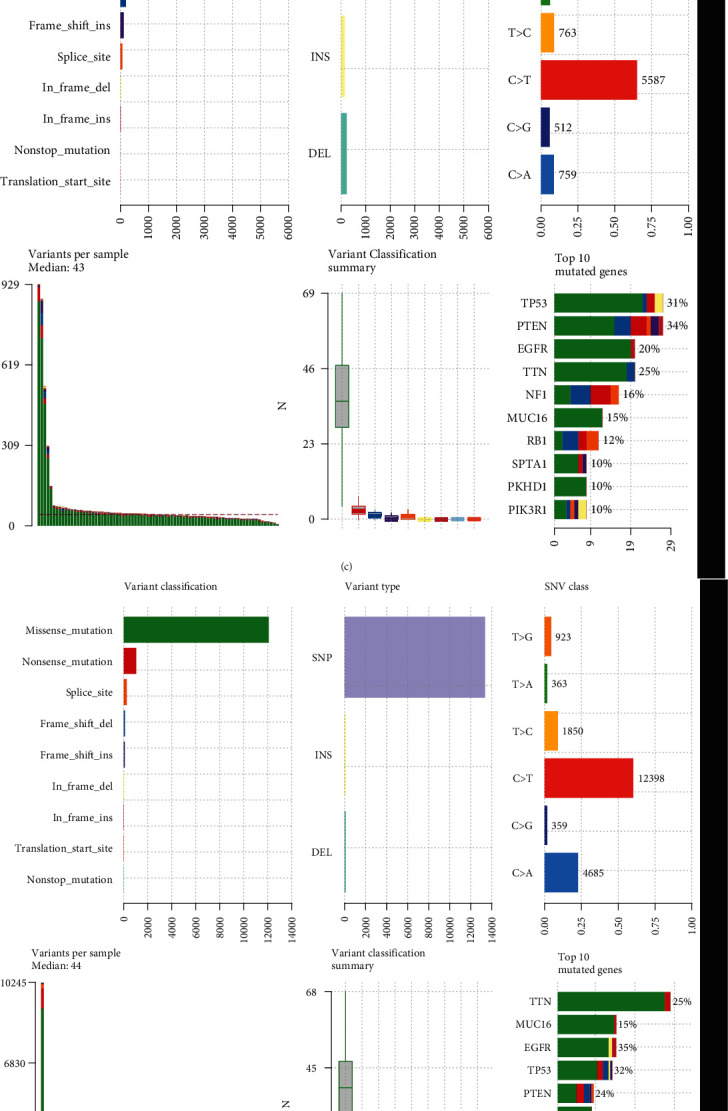
Genetic mutation landscape in high- and low-risk GBM. (a, b) The frequency of the top ten mutation genes in high- and low-risk GBM groups. Mutation type was identified by unique color. (c) Landscape of genetic mutation in the high-risk GBM group. (d) Landscape of genetic mutation in the low-risk GBM group. (e) Comparison of the first eight mutation genes between high- and low-risk GBM groups. ∗P < 0.05. (f) Distribution of TMB score across GBM samples. (g) Comparison of TMB score between high- and low-risk GBM groups.