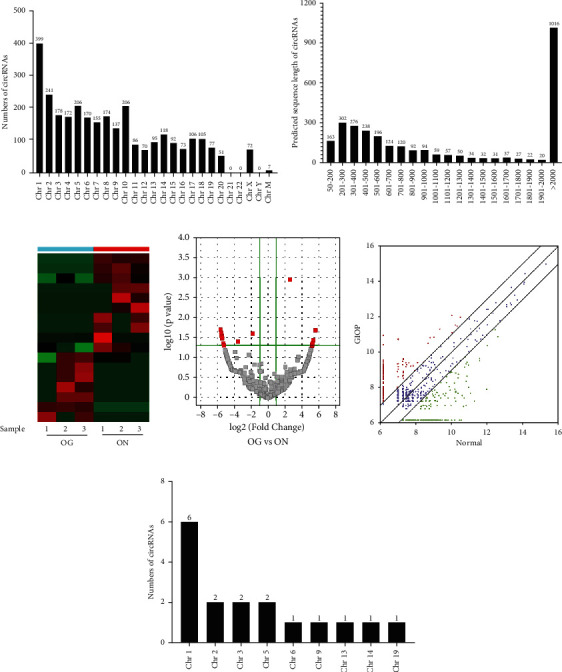
Figure 3.

The profile of circRNAs in the OG and ON groups. Distribution of circRNAs in chromosomes (a); “ChrM” represents the mitochondrial genome. The length distribution of 2990 circRNAs (b); the majority (33.63%) were 201-500 nt in size. A heat map was generated to assess the differentially expressed circRNAs between OG and ON (c). Volcano plot and scatter plot showing that 10 circRNAs were downregulated and 7 circRNAs were upregulated during osteogenesis (d, e). The distribution of differentially expressed circRNAs on chromosomes (f).
