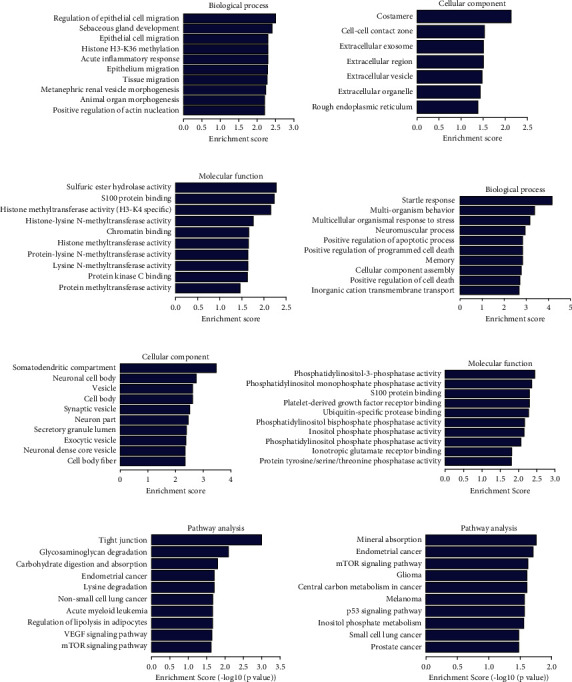
Figure 5.

GO analyses and KEGG pathway analysis: enrichment map of GO analyses of upregulated circRNAs: biological process, cellular component, and molecular function (a, b, c); enrichment map of GO analyses of downregulated circRNAs: biological process, cellular component, and molecular function (d, e, f); enrichment map of KEGG pathway analysis of upregulated circRNAs (g); enrichment map of KEGG pathway analysis of downregulated circRNAs (h).
