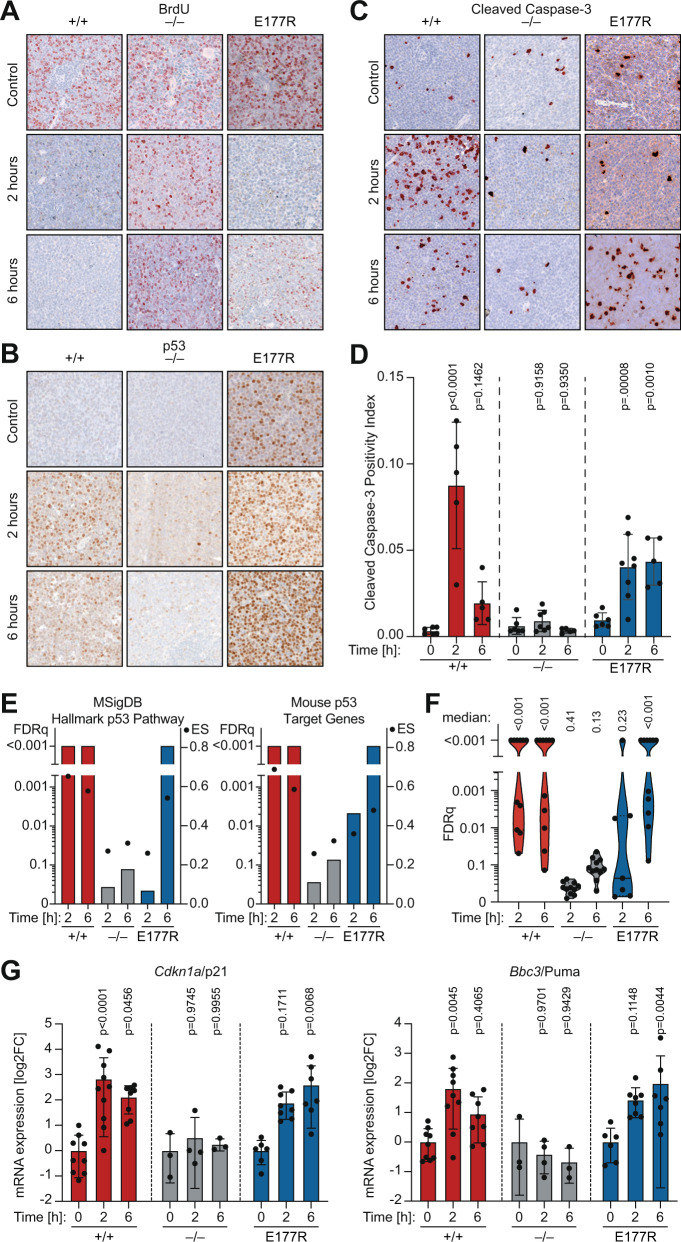
Fig. 7. Apoptotic chemotherapy response in Trp53E177R AML.
A–C, Representative IHC images of spleen samples stained for A BrdU as proliferation marker, B p53 protein, and C cleaved caspase 3 (CC3) as apoptosis marker. D Quantification of CC3 in 10 fields of view per mouse sample. Shown are mean ± SD; datapoints represent individual mice; 2way ANOVA with Dunnett’s multiple comparisons test. E, F Leukemia samples were collected from control and treated mice at 2 and 6 hours after therapy and analyzed by RNAseq and GSEA. E Graphs depict GSEA results for the indicated gene sets in pairwise comparisons between control and treated leukemias. Bars, false discovery rate (FDRq); dots, enrichment score. F Violin plots illustrate distribution of FDRq values from GSEA with multiple p53-related gene sets (Table S1). Each data point represents one gene set. G mRNA expression (RT–qPCR) of p53 target genes Cdkn1a and Bbc3 normalized to Actb (β-actin). Shown is the mean ± SD log2-fold change in treated leukemia samples relative to untreated; 2way ANOVA with Dunnett’s multiple comparisons test; datapoints represent individual mice.

