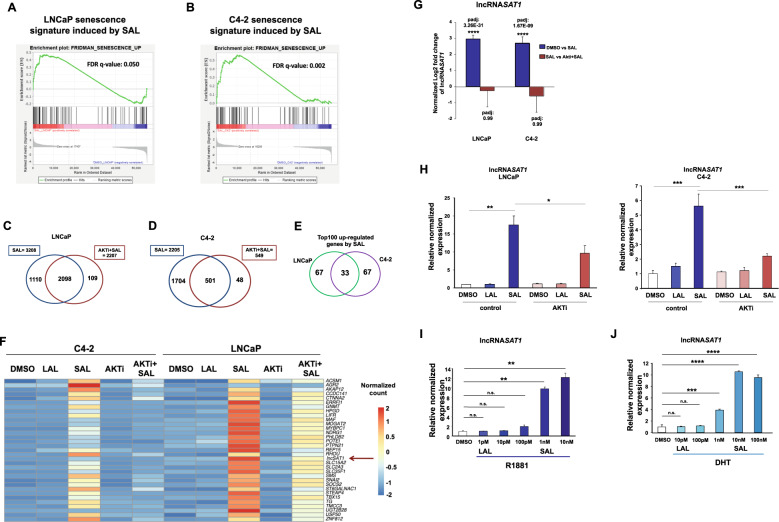
Fig. 5. Differential expression analysis indicates that AKTi significantly alters expression of most genes regulated by SAL and identifies the lncRNASAT1.
RNA-seq experiments with both cell lines LNCaP and C4-2 were performed with the indicated treatments for 72 h. Data are presented as means ± LFC SE (Log2 fold change standard error). Two-tailed paired Student’s t test was performed for statistical analysis (n = 3; ***padj ≤ 0.001, ****padj ≤ 0.0001). A, B Plot of gene-set enrichment analysis (GSEA) of the senescence. The senescence signature is induced by SAL in both cell lines. Positive enrichment of the gene set in R1881 vs. DMSO; in (A) LNCaP, FDR q value = 0.050, and (B) C4-2, FDR q value = 0.002. C, D GSEA plot for senescence. Venn diagram depicts the number of genes being significantly regulated by SAL and number of genes altered by AKTi cotreatment in (C) LNCaP or (D) C4-2 cells. The induced senescence signature is significantly rescued by AKTi in both (A) LNCaP, FDR q value = 0.002 and (B) C4-2 cells, FDR q value = 0.083. E Venn diagram indicates the overlap of top100 significantly SAL-regulated genes between LNCaP and C4-2 cells. F Heat map represents the 33 genes upregulated upon SAL in both LNCaP and C4-2 cells. Color-key number represents normalized count. G Normalized log2 fold change of lncRNASAT1 upon SAL or AKTi + SAL in both LNCaP and C4-2 cells of RNA-seq data. H Confirmed regulation of the lncRNASAT1 using qRT-PCR in both LNCaP and C4-2 cells. I, J Concentration-dependent induction of the lncRNASAT1 by androgens using (I) R1881 or (J) DHT in LNCAP cells treated for 72 h by qRT-PCR. Values were normalized to TBP and GAPDH and relative expression was calculated compared with control treatment. Bars indicate the mean ± SEM (n = 4). *p ≤ 0.05, **p ≤ 0.01, ***p ≤ 0.001, ****p ≤ 0.0001, n.s. not significant.

