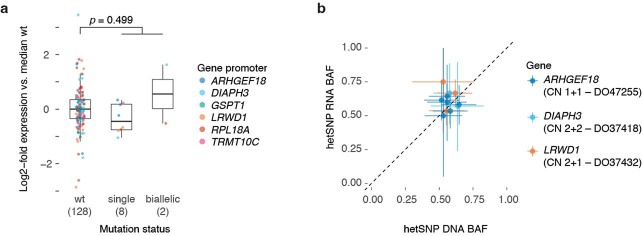
Extended Data Fig. 9. Effect of promoter mutation on gene expression for genes with biallelic hits.
(a) Box and scatter plot showing the log2-fold change in expression (FPKM-UQ, Methods) compared to the median wild type for promoter mutated genes in Fig. 5a. Each dot represents the relative expression in a single PCAWG melanoma with RNA-Seq data, stratified by the mutation status of that gene’s promoter. The total number of tumors for each category is indicated between parentheses. Centre line, median; box limits, upper and lower quartiles; whiskers, 1.5x interquartile range. A two-sided Student’s t-test was used to evaluate the difference between the log2-transformed expression values of wild type vs the pooled single and biallelic mutant cases. (b) Scatter plot of the DNA and RNA B-allele frequencies of expressed germline heterozygous SNPs in the genes/samples with a single mutant promoter allele in (a). The ICGC donor ID and local consensus copy number are indicated. Error bars and the centre represent, respectively, the posterior 95% highest density interval and maximum likelihood estimate of the DNA and RNA B-allele frequencies assuming a uniform prior and a binomial likelihood for the allele counts.

