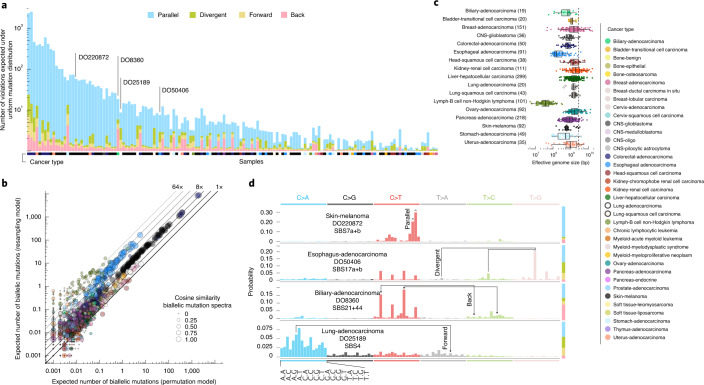
Fig. 2. Simulated landscape of infinite sites violations in the PCAWG cohort.
a, Number and type of infinite sites violations in 147 PCAWG samples with ≥1 expected violation under a uniform mutation distribution. The bar height indicates the expected number of violations and the colored subdivisions represent the fractions contributed by each violation type. Tumor type of the samples is color-coded below the bars. The four samples highlighted in d are indicated. b, Comparison of the expected biallelic violations from the uniform permutation and neighbor resampling models. Every dot represents a tumor simulated 1,000 times with each model. Color and size reflect, respectively, tumor type and the cosine similarity of the predicted biallelic mutation spectra. c, Box and scatterplot showing the effective genome size perceived by the mutational processes per cancer type, as estimated from the per-sample differences between simulation approaches. The dashed line indicates the callable genome size. The effective genome size is smallest in Lymph-BNHL (approximately 37 Mb), likely driven by recurrent focal hypermutation13. Center line, median; box limits, upper and lower quartiles; whiskers, 1.5× interquartile range. Only tumors with ≥10 biallelic mutations across 1,000 simulations are included and their numbers are indicated between parentheses next to the tumor type. Only tumor types with ≥10 such tumors are shown. CNS, central nervous system. d, Mutation spectra of four tumors with distinct violation contributions indicated in a. The 16 distinct trinucleotide contexts are provided on the x axis for C>A type substitutions and are the same for each colored block. The proportion of parallel, divergent, back and forward mutations is indicated in the stacked bar on the right. Frequent combinations of mutations leading to specific infinite site violations are highlighted as well as the signatures generating them.

