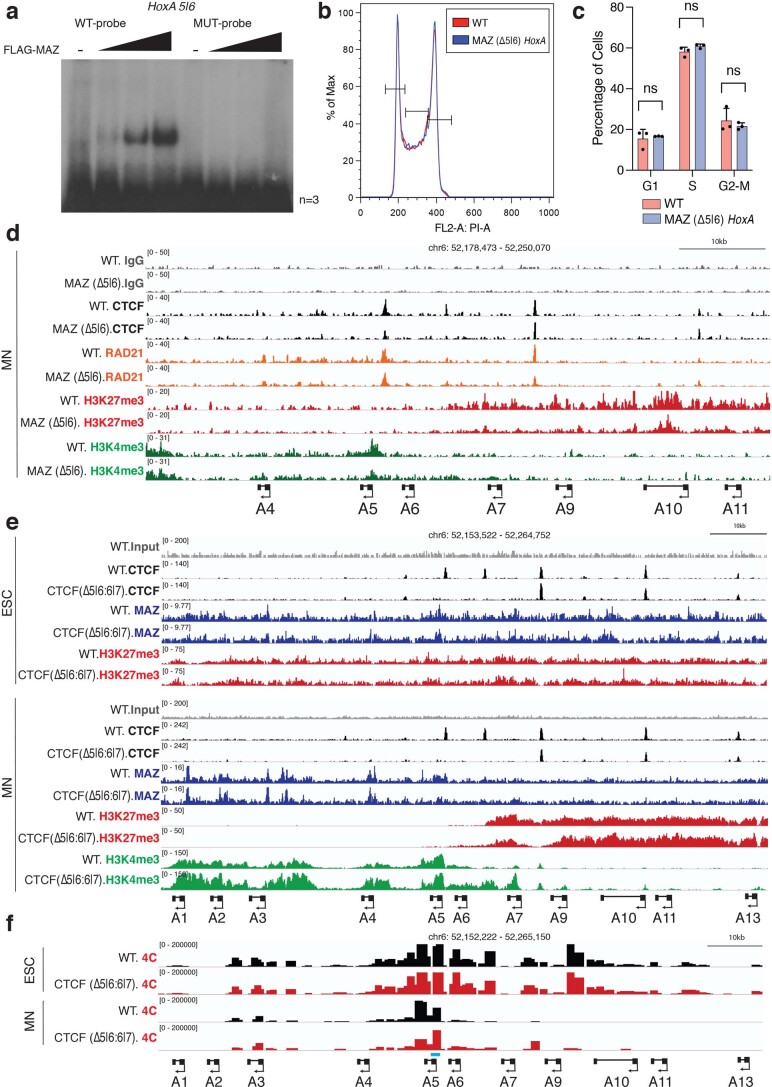
Extended Data Fig. 6. Loss of MAZ motifs perturbs CTCF-boundary features at HoxA.
a, EMSA assay indicating FLAG-MAZ binding to MAZ motifs at Hoxa5|6 MAZ binding sites in WT probes in comparison to mutant (MUT) probes. One representative of three biological replicates is shown. b, FACS analysis of cell cycle in WT versus MAZ (∆5|6) ESCs (see Supplementary Fig. 7b for gating of cells). c, Quantification of cell cycle analysis by FACS in WT versus MAZ (∆5|6) ESCs (see Supplementary Fig. 7b for gating of cells). Data are represented as mean values and error bars indicating SD across three biological replicates. Two-sided Student’s t-test (unpaired) was used without multiple testing correction (black dots: individual data points). d, Normalized CUT&RUN signals for CTCF, RAD21, and indicated histone modifications in the HoxA cluster in WT versus MAZ (∆5|6) MNs that were sorted for double-positives (Hoxa5-P2A-mCherry and Hoxa7-P2A-eGFP). CUT&RUN tracks are from one representative of two biological replicates for H3K4me3, and one replicate for others. e, Normalized ChIP-seq densities for CTCF, MAZ, and indicated histone modifications in WT and CTCF (∆5|6:6|7) ESCs and MNs in the HoxA cluster. ChIP-seq tracks are from one representative of two biological replicates for all except for one replicate for MAZ, and histone modifications in CTCF (∆5|6:6|7) ESCs and MNs. f, 4C contact profiles in WT versus CTCF (Δ5|6:6|7) ESCs and MNs, using a viewpoint shown in blue at indicated region at Hoxa5. One representative of three biological replicates is shown for all except for two replicates for WT MNs.

