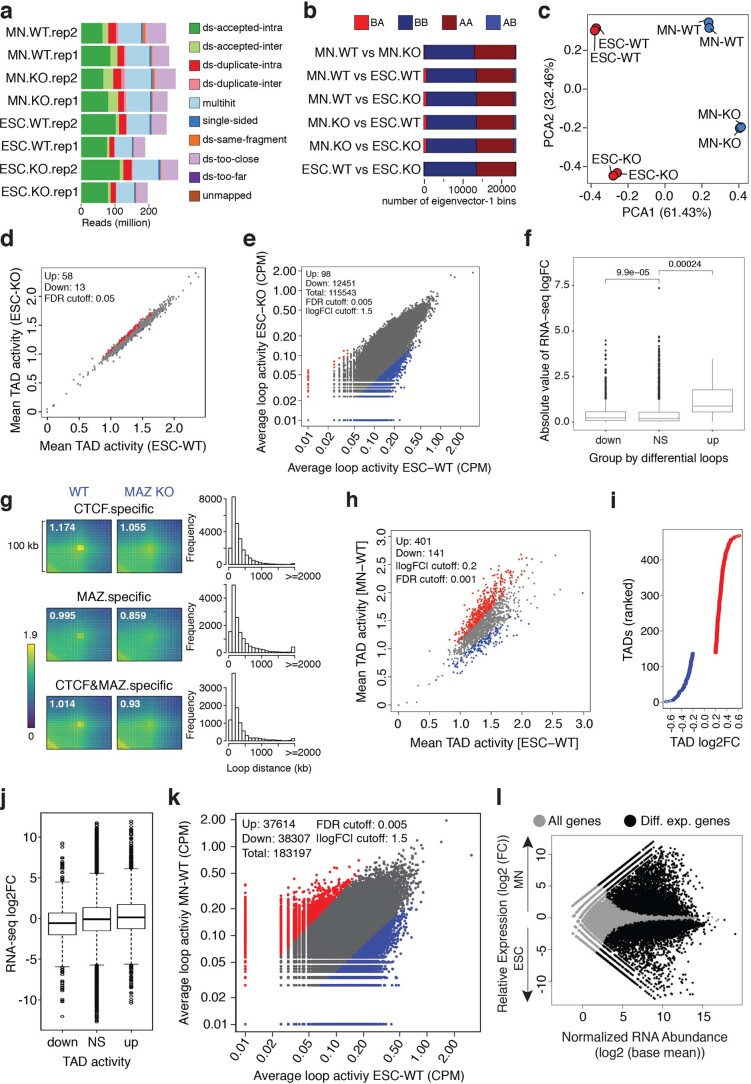
Extended Data Fig. 8. Global genome organization as a function of MAZ KO or differentiation.
a, Bar plot of Hi-C read counts across the samples. b, Bar plot of compartment switches between active (A) and inactive (B) compartments in ESCs and MNs. c, Principal Component Analysis (PCA) of boundary scores in WT ESCs, MAZ KO ESCs, WT MNs, and MAZ KO MNs. d, Scatter plot showing differential intra-TAD activity in WT versus MAZ KO ESCs (FDR cutoff = 0.05). Down, downregulated; Up, upregulated. e, Scatter plot showing differential loop activity in WT versus MAZ KO ESCs (all loops, n = 115,543, FDR cutoff = 0.005, | log (fold change) | cutoff = 1.5, Upregulated: 98, Downregulated: 12,451). Down, downregulated; Up, upregulated. f, Boxplot of absolute value of RNA-seq log (fold change) of genes within the differential loops (down/up) versus nonsignificant (NS) loops in WT versus MAZ KO ESCs. P values are shown for unpaired one-sided Wilcoxon rank sum test. The median is shown at the center line and the whisker extends up to 1.5 times the interquartile range, using the default parameters (n = 3 and n = 2 biologically independent experiments for RNA-seq and Hi-C, respectively). Down, downregulated; Up, upregulated. g, APA of loops in WT versus MAZ KO ESCs showing ChIP-seq signals of CTCF, MAZ, or both at any occupied regions. The resolution of APA is 5 kb. The APA score is reported on top of each plot. Histograms show the distribution of loop distance in MAZ KO compared to WT related to the binding level of ChIP-seq. h, Scatter plot showing differential intra-TAD activity in WT ESC versus MNs (FDR cutoff = 0.001, log (fold change) cutoff = 0.2). Down, downregulated; Up, upregulated. i, TADs (n = 467) ranked by TAD activity change in ESCs versus MNs. j, Boxplot of RNA-seq log2(fold change) in TADs with up/downregulated activity compared to nonsignificant (NS) activity in ESCs versus MNs (n = 3 and n = 2 biologically independent experiments for RNA-seq and Hi-C, respectively). The center bar displays the median value and the box boundaries were drawn at the 25th and the 75th percentiles, respectively. Whiskers were defined by 1.5 times the interquartile range from the box. Down, downregulated; Up, upregulated. k, Scatter plot showing differential loop activity in WT ESCs versus MNs (all loops, n = 183,197, FDR cutoff = 0.005, | log (fold change) | cutoff = 1.5, Upregulated: 37,614, Downregulated: 38,307). Down, downregulated; Up, upregulated. l, RNA-seq MA plot of WT ESCs versus MNs from three biological replicates. Differentially expressed genes are selected as P value adjusted (padj) < 0.001 by using the Wald test built into DEseq2.

