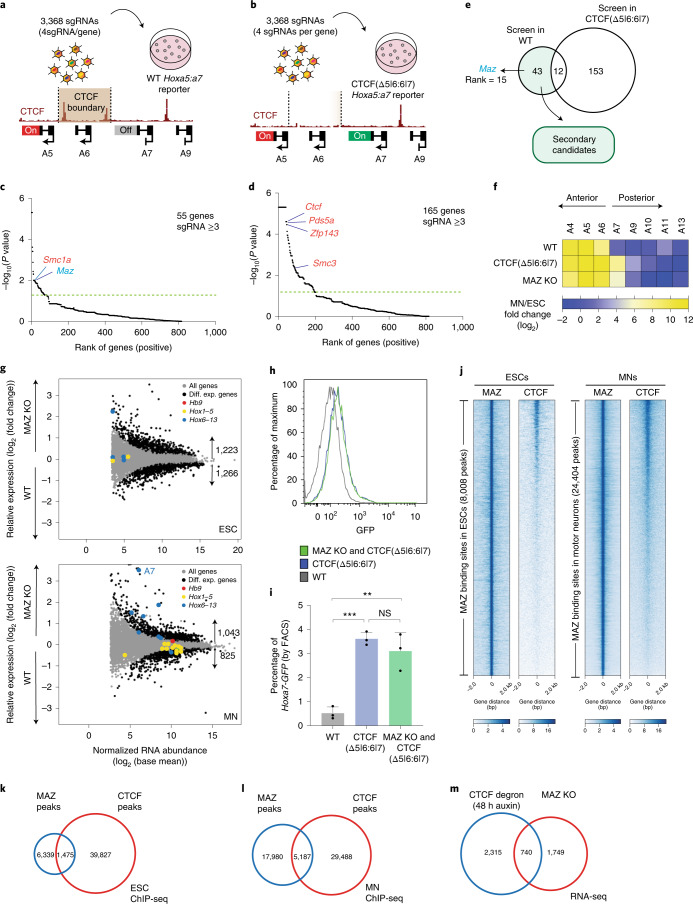
Fig. 2. Secondary CRISPR loss-of-function screens and individual validation of MAZ as an insulator-like factor functioning at CTCF boundaries in Hox clusters.
a, Scheme of secondary screen performed in the WT background. b, Scheme of secondary screen performed in the CTCF (Δ5|6:6|7) background. c, Rank of genes overrepresented in boundary-disrupted MNs versus WT MNs in one biological replicate. Cutoff line indicates P < 0.05. The statistics were derived based on MAGeCK tools (Methods). d, Rank of genes overrepresented in the dual-positive Hoxa5:a7 MN population (further disrupted boundary) versus the Hoxa5-mCherry-positive population (WT) in two biological replicates. Cutoff line indicates P < 0.05. The statistics were derived based on MAGeCK tools (Methods). e, Venn diagram depicting overlap of secondary genetic screens in WT versus CTCF(Δ5|6:6|7) background. f, Heat map of relative gene expression in WT, CTCF(Δ5|6:6|7) and MAZ KO at the HoxA cluster in MNs versus ESCs from three biological replicates. Maz KO represents three independent clones. g, RNA sequencing (RNA-seq) MA plot of WT versus MAZ KO ESCs (top), and MNs (bottom) from three biological replicates. Differentially expressed (Diff. Exp.) genes are selected as P value adjusted < 0.05 using the Wald test built into DESeq2. Hox genes in four Hox clusters are colored based on their position with respect to the previously demonstrated CTCF boundary in MNs. Hb9 is an MN marker. h, Flow cytometry analysis of MNs with the indicated genotypes: WT, CTCF(Δ5|6:6|7) and MAZ KO & CTCF(Δ5|6:6|7). This plot is one representation of three biological replicates quantified in Fig. 2i (gating of cells is shown in Supplementary Fig. 7a). i, Percentage of Hoxa7-eGFP cells quantified based on FACS analysis in MNs with the indicated genotypes: WT, CTCF(Δ5|6:6|7) and MAZ KO & CTCF(Δ5|6:6|7). Data are represented as mean values, and error bars indicate standard deviation across three biological replicates. Results from MAZ KO and CTCF(Δ5|6:6|7) represent three independent clones. A two-sided Student’s t test (unpaired) was used without multiple-testing correction (black dots represent individual data points; ***P = 0.0002; **P = 0.0052; NS (not significant), P = 0.3379). j, Heat maps of CTCF and MAZ ChIP-seq read density in ESCs and MNs within a 4-kb window centered on the maximum value of the peak signal. bp, base pair. k,l, Overlap of CTCF and MAZ binding sites in ESCs and MNs, respectively. ChIP-seq experiments are from one representative of two biological replicates. m, Overlap of differentially expressed genes in ESCs upon CTCF degradation42,43 and MAZ KO. Differentially expressed genes are selected as P value adjusted < 0.05.

