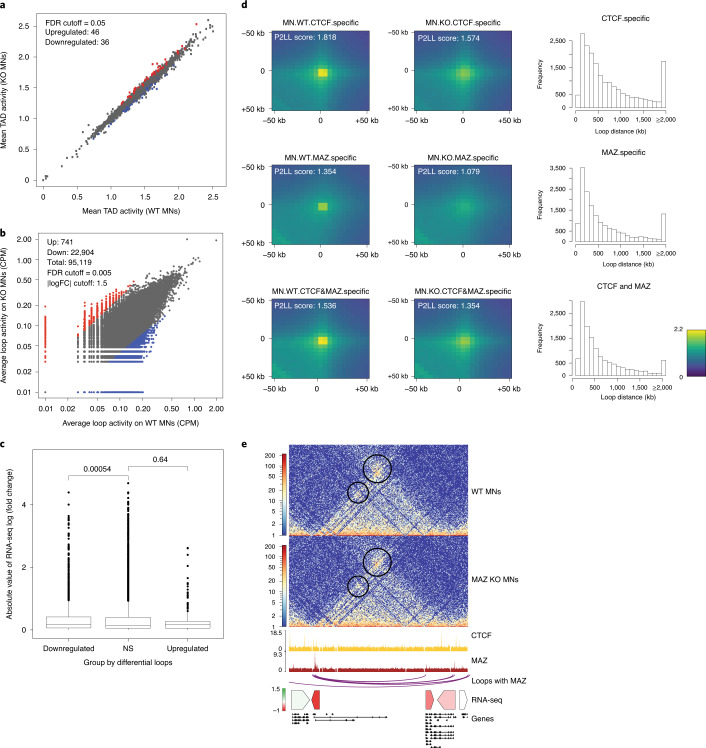
Fig. 4. Effect of MAZ on global genome organization.
a, Scatter plot showing differential intra-TAD activity in WT versus MAZ KO MNs (FDR cutoff = 0.05). Down, downregulated; Up, upregulated. b, Scatter plot showing differential loop activity in WT versus MAZ KO MNs (all loops, n = 95,119, FDR cutoff = 0.005, | log (fold change) | cutoff = 1.5, upregulated = 741, downregulated: 22,904). CPM, counts per million reads mapped. c, Boxplot of absolute value of RNA-seq log (fold change) of genes within the differential loops (down-/upregulated) versus nonsignificant (NS) loops in WT versus MAZ KO MNs. P values are shown for unpaired one-sided Wilcoxon rank sum tests. The median is shown at the center line, and the whisker extends up to 1.5 times the interquartile range using the default parameters. d, APA of loops in WT versus MAZ KO MNs showing ChIP-seq signals of CTCF, MAZ or both at any region covered by them. The resolution of APA is 5 kb. Histograms show the distribution of loop distance in MAZ KO compared to WT related to the binding level of ChIP-seq. P2LL, (Peak to Lower Left) is the ratio of the central pixel to the mean of the mean of the pixels in the lower left corner. e, Visualization of Hi-C contact matrices for a zoomed-in region around the Shh locus in WT versus MAZ KO MNs. Shown below are ChIP-seq read densities for CTCF and MAZ, loops with MAZ at both anchors in MNs, heat map of RNA-seq log2 (fold change) of underlying genes and all gene annotations.

