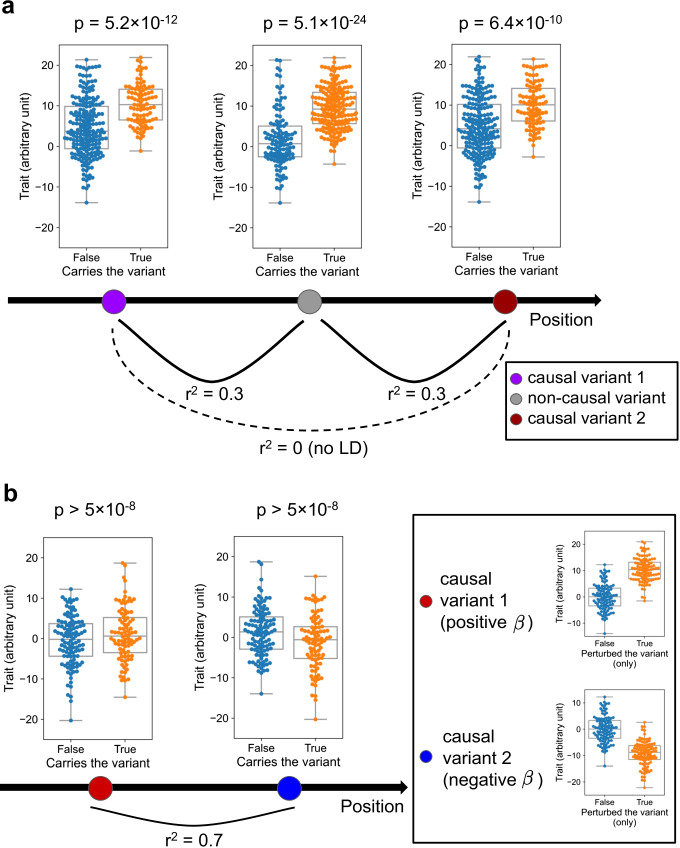
Fig. 2.
Two simplified examples where marginal p-value fails to prioritize the true causal variants. a The non-causal variant (center), frequently tagging one of the two true causal variants, has the most significant association p-value (in F-test) as well as the highest marginal effect size (7.8 vs 5.8 and 5.3). b Two nearby causal variants in LD harboring high true effect sizes to the opposite direction, both have limited marginal association p-values that do not reach the statistical significance under multiple test correction (p = 0.06 and 0.007). Synthetic samples of n = 300 for a and n = 200 for b were generated, with true = 10 and drawn from a normal distribution with SD = 5 for simplicity (therefore, y axis has no unit). r = 0.317, 0.317, and 0.0353 for a and 0.734 for b The code is
available at http://github.com/QingboWang/fm-toy

