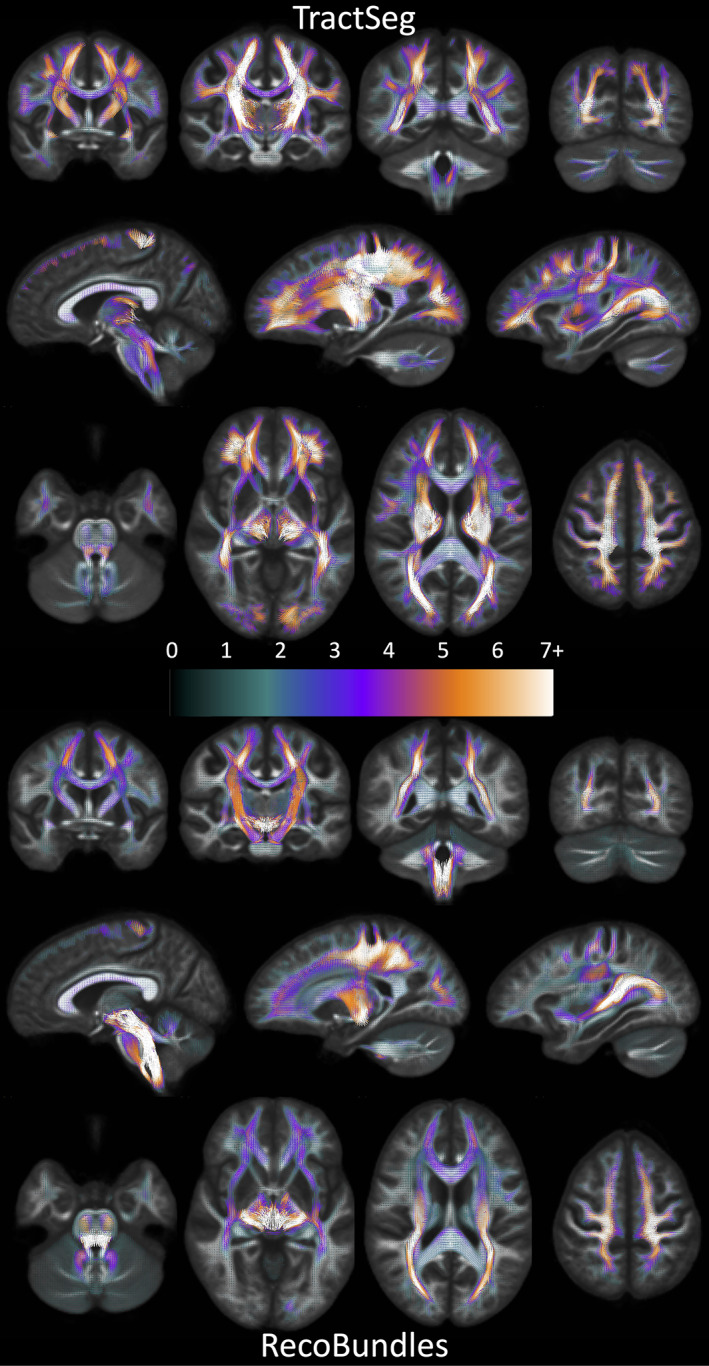
FIGURE 4.

There is a high prevalence of bundles assigned to each fixel in the brain. Fixels, in template‐space, are shown as vectors, colored by the number of associated bundles, and averaged across the population (note continuous color‐map due to population‐averaging). TractSeg results are shown on top, Recobundles on bottom. Fixels with more than one bundle traversing through them represent bottleneck regions for tractography
