
FIGURE 5.
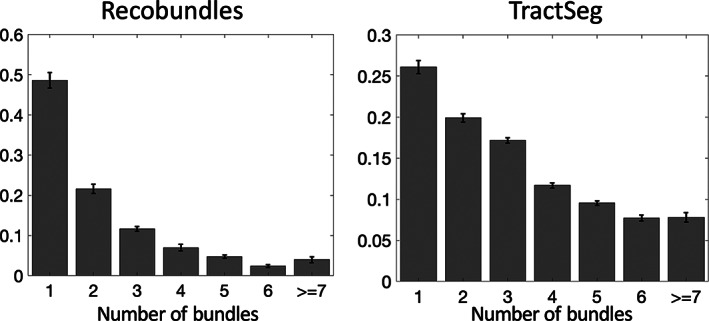
Number of bundles assigned to fixels in the brain, averaged across the population. Most fixels had greater than one bundle traversing through their designated orientation. Note that fixels which were assigned to 0 bundles are not shown. Y‐axis is shown as a fraction of fixels. Error bars represent variation across the studied population