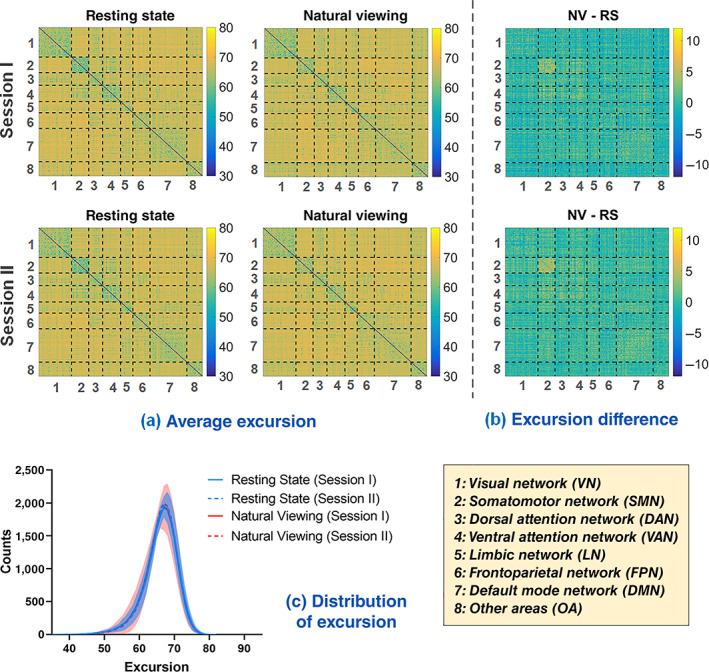
FIGURE 2.

The Excursion of dFC. (a) The group average Excursion matrix of each session for resting state and natural viewing, respectively. (b) The group average Excursion differences between two conditions: natural viewing (NV) minus resting state (RS). (c) The distribution of Excursion across all the ROI pairs from each session of resting state (in cyan) and natural viewing (in magenta). Shade signifies standard error of the mean (SEM) across subjects. For visual clarity, only the SEM of Session I is displayed for each condition
