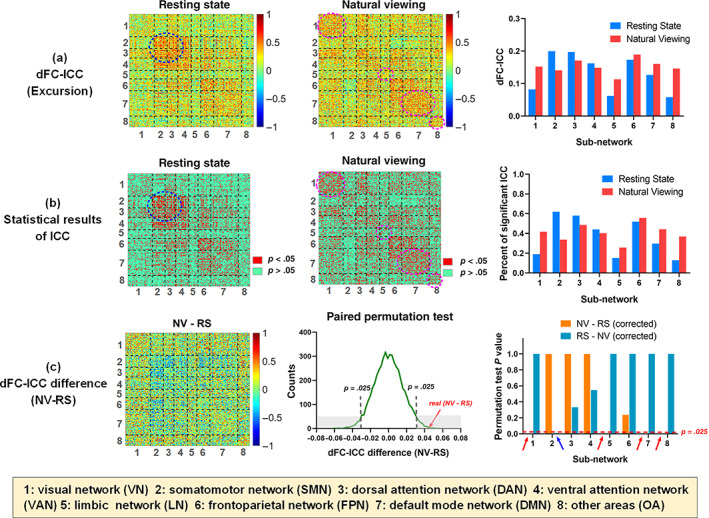
FIGURE 3.

The dFC‐ICC and statistical results. (a) The first and second columns were the Excursion‐based dFC‐ICC matrices of resting‐state and natural viewing conditions. The last column showed the average dFC‐ICC results of 8 sub‐networks (i.e., intranetwork ICC) for both conditions. (b) The statistical results of dFC‐ICC based on one‐way ANOVA model. The first and second columns showed the ROI pairs with significant ICC results in red color (p <.05). The last column showed the percentages of significant ICC values in each sub‐network for both conditions. (c) The first column was the dFC‐ICC difference matrix, that is, natural viewing (NV) dFC‐ICC minus resting state (RS) dFC‐ICC. The second column showed the paired permutation test of the dFC‐ICC difference (NV − RS) with gray dashed lines indicating 95% CIs. The last column showed the p values of each intranetwork average dFC‐ICC difference between two conditions after FDR correction across the sub‐networks
