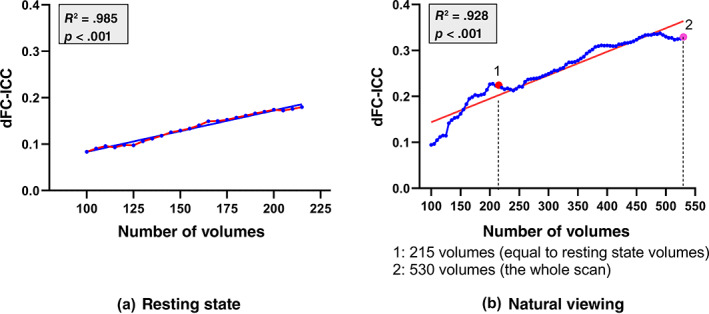
FIGURE 6.

The dFC‐ICC variations along with the involved number of volumes in dFC analysis with an increment of 5 volumes (in blue). A linear regression model was estimated with dFC‐ICC as the dependent factor and the number of volumes as the independent factor (red line) for resting‐state (a) and natural viewing (b) conditions, respectively
