
FIGURE 1.
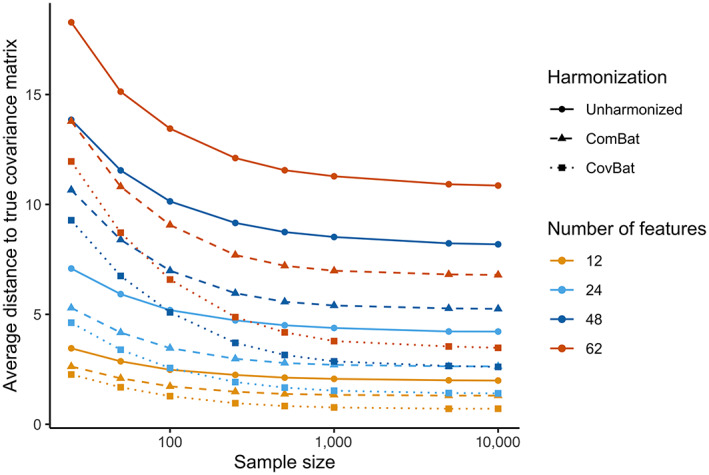
Average across sites of the Frobenius distance between sample site‐specific covariance matrices and the true covariance matrix for the Simple Covariance Effects simulation. The displayed values are averaged across the mean Frobenius distance for each site, which are taken across 1,000 simulations each. Results are plotted for a sample size per site of 25, 50, 100, 250, 500, 1,000, 5,000, and 10,000