
FIGURE 3.
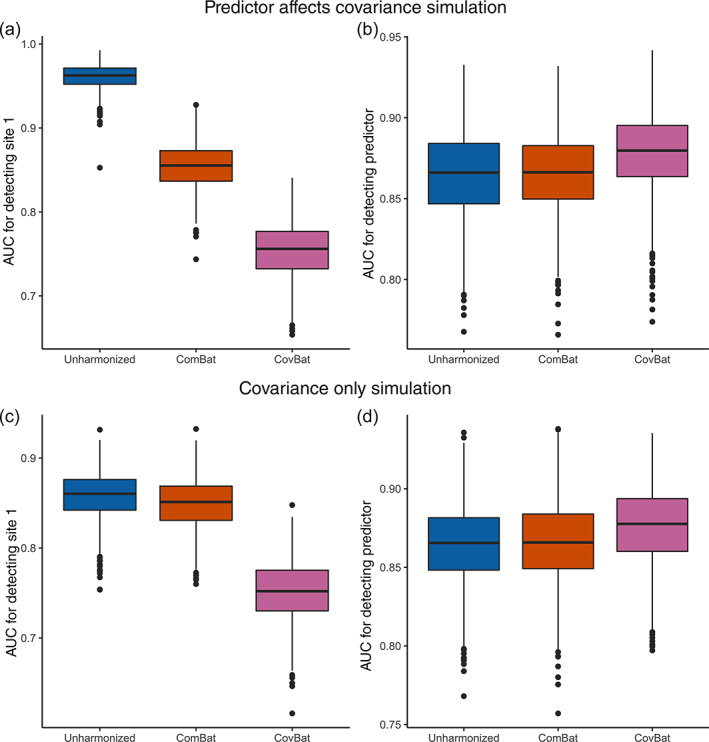
Results from ML simulations for detection of site and for detection of the simulated diagnosis where the simulated diagnosis also confounds covariance. The simulated data consists of 62 cortical thicknesses for 250 subjects per site across three sites. For each of 1,000 simulations, the data is randomly split into 50% training and 50% validation. A random forests algorithm is trained using the training set to predict either Site 1 or the presence of the simulated diagnosis. (a), Boxplot showing Site 1 detection in the Diagnosis Affects Covariance simulation. (b), Boxplot showing simulated diagnosis detection in the diagnosis affects covariance simulation. (c), Boxplot showing Site 1 detection in the covariance only simulation. (d), Boxplot showing simulated diagnosis detection in the Covariance Only simulation