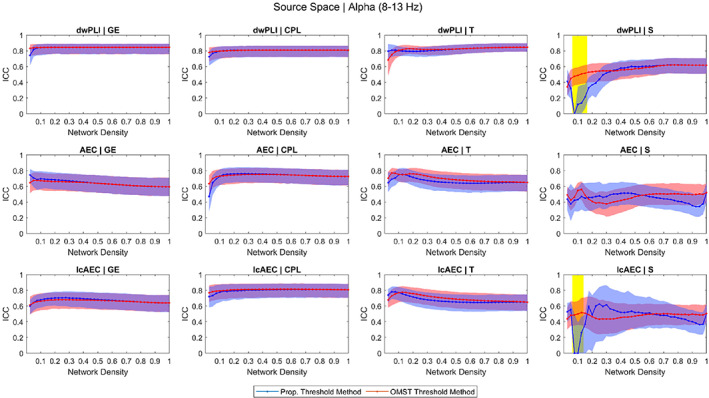
FIGURE 3.

Intraclass correlation coefficient (ICC) of the four graph measures computed using three functional connectivity metrics in the source space for the alpha band across different network density levels achieved using the proportional weight and orthogonal minimum spanning tree (OMST) thresholding methods. The blue and red shaded areas represent 95% bootstrap confidence intervals for the ICC values. The yellow shaded area represents ICC values that were significantly different (p < .05, false discovery rate [FDR]‐adjusted) between the proportional and OMST thresholding methods
