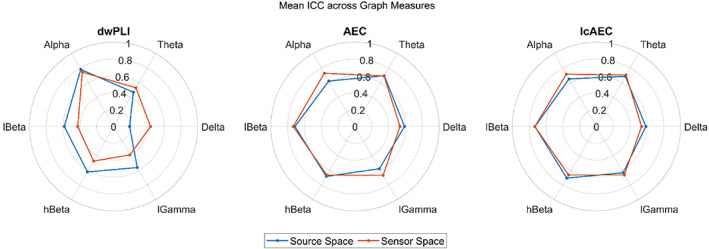
FIGURE 5.

Graphical comparison of the mean intraclass correlation coefficient (ICC), averaged across the four graph measures calculated at a 100% density level, for the three functional connectivity metrics in the sensor and source spaces

Graphical comparison of the mean intraclass correlation coefficient (ICC), averaged across the four graph measures calculated at a 100% density level, for the three functional connectivity metrics in the sensor and source spaces