
FIGURE 5.
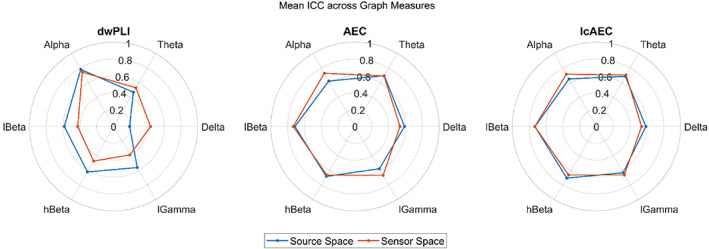
Graphical comparison of the mean intraclass correlation coefficient (ICC), averaged across the four graph measures calculated at a 100% density level, for the three functional connectivity metrics in the sensor and source spaces
Official websites use .gov
A
.gov website belongs to an official
government organization in the United States.
Secure .gov websites use HTTPS
A lock (
) or https:// means you've safely
connected to the .gov website. Share sensitive
information only on official, secure websites.
Graphical comparison of the mean intraclass correlation coefficient (ICC), averaged across the four graph measures calculated at a 100% density level, for the three functional connectivity metrics in the sensor and source spaces