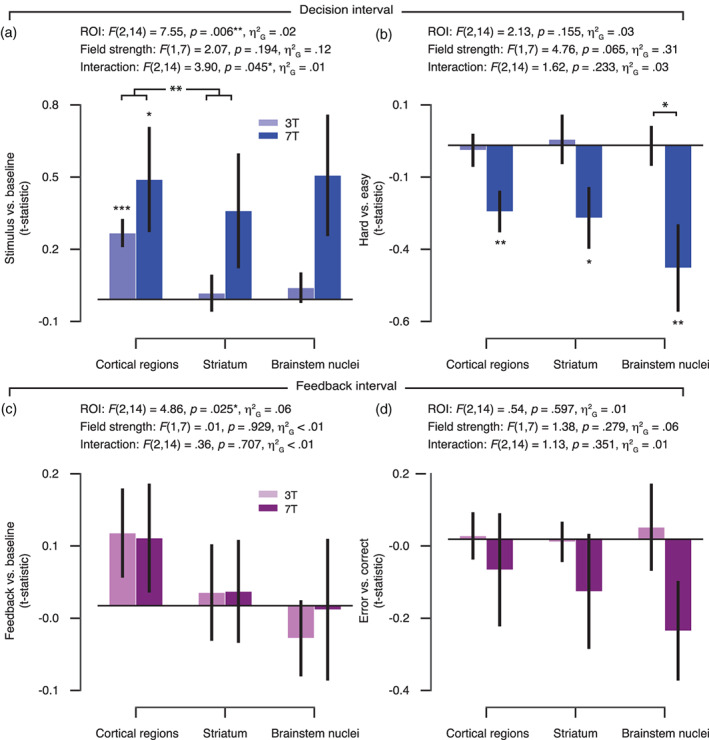
FIGURE 3.

Task‐evoked responses for 3 and 7 T acquisitions across cortical regions, striatum, and brainstem nuclei. (a) Amplitude of evoked response per region of interest (ROI) group (cortical regions, striatum, and brainstem nuclei) and field strength for the overall response within the decision interval (stimulus‐locked and compared to the implicit baseline). (b) The amplitude difference between hard as compared with easy trials (decision interval). (c) Amplitude of evoked response per ROI group and field strength for the overall response within the feedback interval (feedback‐locked and compared to the implicit baseline). (d) The amplitude difference between error as compared with correct trials (feedback interval). The 3 T amplitudes were averaged across 3 T‐A and 3 T‐B data subsets. Results of the repeated‐measures analysis of variance (ANOVA) are given for each contrast of interest: F‐statistics, main effect of ROI group, field strength, and their interaction. Planned comparisons: *p < .05, **p < .01, ***p < .001 (two‐tailed permutation tests). Error bars, SEM (N = 8)
