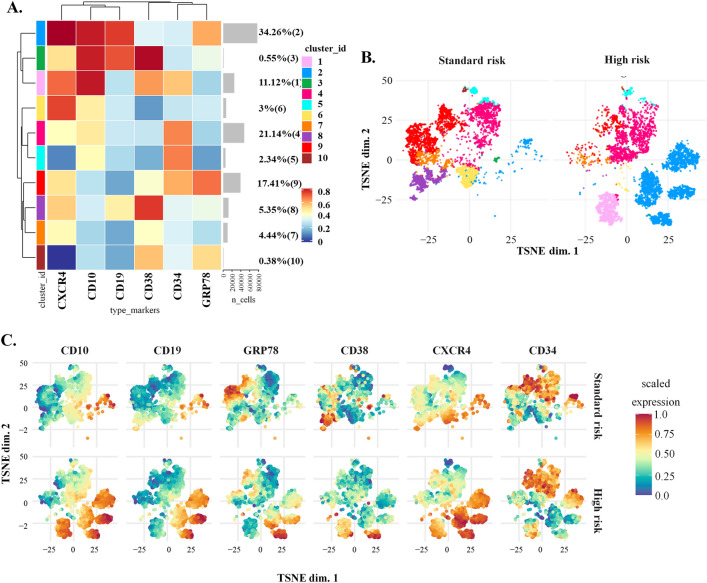
Figure 3.
Dimensional reduction of flow cytometry data from Standard and High-risk LLA patients. (A) Cluster organization and heatmap of the median marker intensities of the lineage markers and sGRP78. (B) TSNE based on the 10 clusters obtained by FlowSOM comparing LLA Standard-risk group (Standard-risk) against LLA High-risk group (High-risk). (C) TSNE showed the expression level of each marker separated by group risk. Heat maps were built by using Cytometry dATa anALYSis Tools (CATALYST). https://bioconductor.org/packages/3.10/bioc/html/CATALYST.html.

