Figure 2.
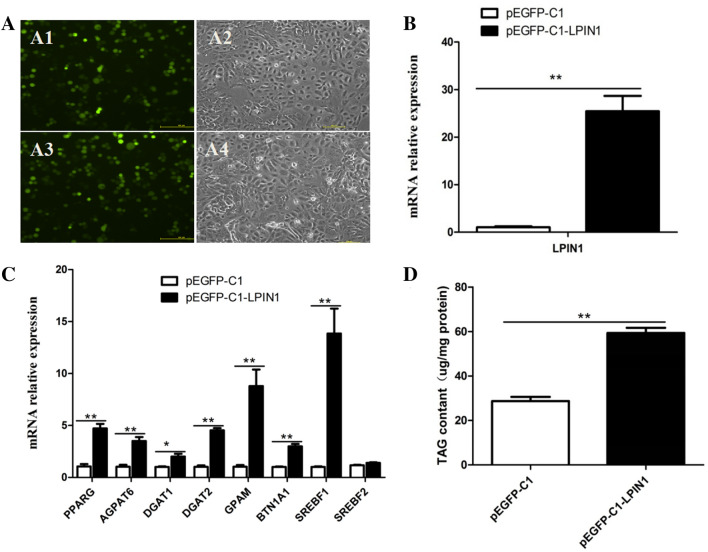
Effect of LPIN1 overexpression in the BMECs. (A) Fluorescence results of LPIN1 overexpression in the BMECs. (A1). Green fluorescence of control group (pEGFP-C1); (A2) Ordinary light of control group (pEGFP-C1); A3. Green fluorescence of pEGFP-C1-LPIN1; A4. Ordinary light of pEGFP-C1-LPIN1; (B) The efficiency of LPIN1 overexpression; (C) The overexpression of LPIN1 up-regulates the expression of genes related to milk fat synthesis in the BMECs; (D) Changes of total TAG content in the BMECs under the LPIN1 overexpression. Values are displayed as means ± SEM for three biological replicates. *, P < 0.05; **, P < 0.01.

