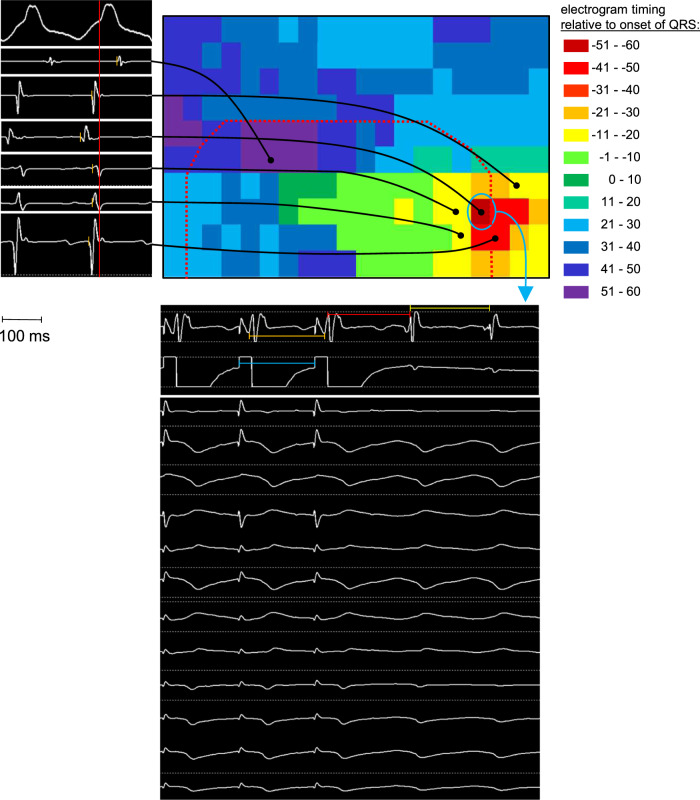
Fig. 1. The schematic depicts the VT mapping process, including example electrograms (top left), a graphical display of the activation time during VT (top right with markers showing the location of the example electrograms), and entrainment pacing from the site of earliest activation (local electrograms in the middle panel and 12-lead ECG at bottom).
The activation mapping process started by moving the catheter throughout the heart during VT, recording electrogram and marking catheter location at each site, and measuring the timing of each electrogram (top left panel, orange lines) against a fiduciary point in the surface ECG (red line in the top left panel). The activation time and location for each point was displayed graphically (top right). Overlaid on the activation map is the edge of the infarct scar (red dotted line) obtained from a separately performed sinus rhythm voltage map. After identifying earliest activation (blue circle in top right panel), we placed the catheter at that location and paced during VT at an output just above threshold and a cycle length 10 ms faster than the tachycardia cycle length. Local electrograms were recorded from the pacing electrodes and the closest adjacent bipole (middle panel). Local capture was confirmed by comparing the timing of the pacing stimulus (blue bar = 180 ms) to the adjacent electrogram (orange bar = 180 ms). Concealed entrainment criteria were met if the timing of the first return beat after pacing (red bar = 196 ms) was within 20 ms of the tachycardia cycle length (yellow bar = 190 ms), and if the paced QRS morphology exactly matched the VT morphology (bottom panel).

