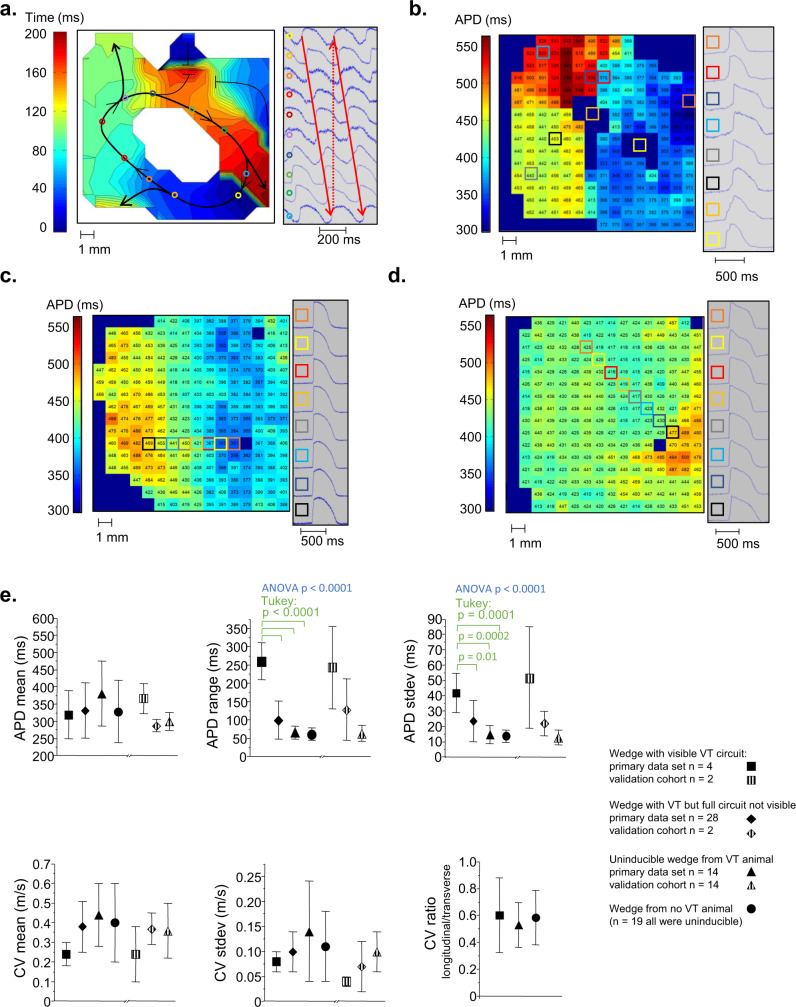
Fig. 4. Optical mapping of myocardial borderzone tissues.
a The entire VT circuit was visible along a single tissue surface in four animals from the primary study and two additional animals in the validation cohort. An isochronal map of a complete VT circuit from one animal is shown. The colored circles indicate locations on the activation map where example pixels at right were located. The white central region had 2:1 activation and did not participate in the VT. b An APD map during 1000 ms fixed rate pacing of the full VT circuit tissue from (a). The colored boxes show locations on the APD map for the example electrograms at right. All observed VT circuits had tissue with short APDs in contact with long APD tissue. The area marked by the yellow and orange squares had complex, multicomponent activation so APD could not be measured. The APD map from tissue with inducible VT but not the complete circuit (c) and the APD map from a no-VT animal (d) are shown). e Summary data are reported as mean ± standard deviation. Data analysis included the Shapiro–Wilk test for normality followed by one-way ANOVA with the post-hoc Tukey test to assess differences. Source data are provided as a Source Data file.

