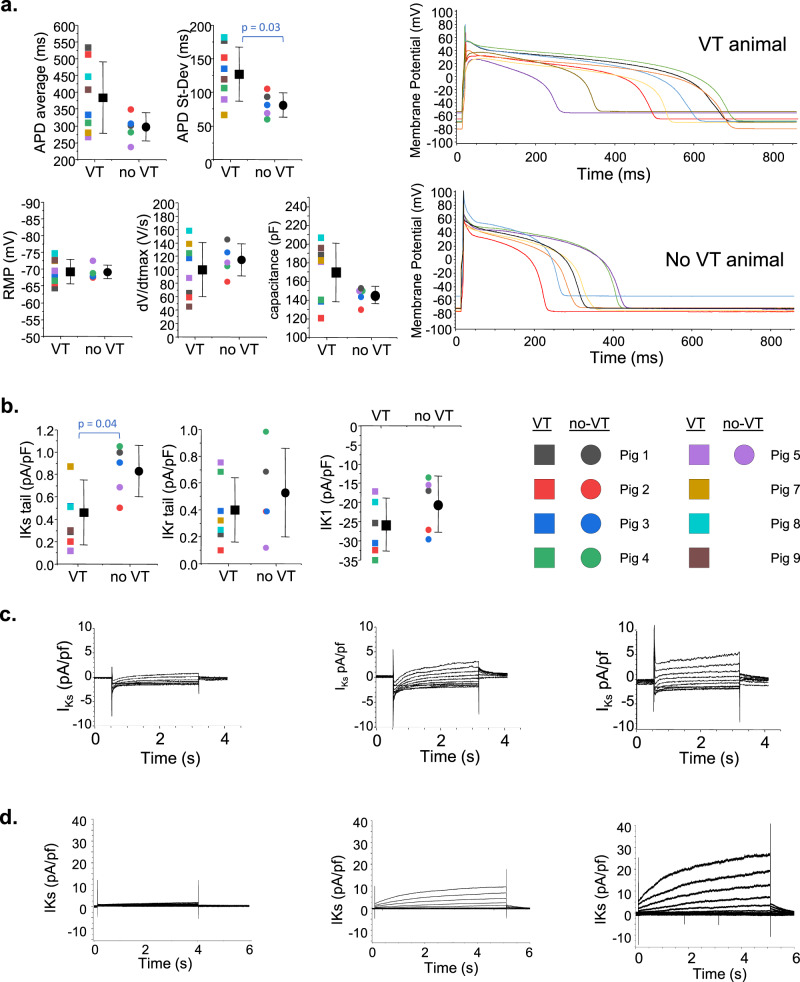
Fig. 5. Patch clamp analysis of cardiac myocytes isolated from the VT region in VT animals and from paired anatomic sites in no-VT animals.
(a) Action potentials show greater heterogeneity in APD for the VT site but no difference in average APD, RMP, or dV/dtmax. The right panel shows APDs recorded from all cells in a single VT animal compared to a single no-VT animal. b Average potassium currents are shown for the three prominent cardiac ventricular repolarizing currents. For the graphs in (a and b), n = 8 biologically independent animals in the VT group and five biologically independent animals in the no-VT group. Data are reported as mean ± standard deviation. Data analysis included the Shapiro–Wilk test for normality followed by Student’s t test to assess differences. c Variability of IKs measured from different cells taken within the VT region from a single animal is shown. Some cells had negligible current (left). Other cells had normal current values and morphologies (center), and other cells had increased IKs with a prominent instantaneous component. This variability was present in 5 of 8 VT animals and 0 of 5 no-VT animals. d IKs tracings from CHO-IKs cells transfected with KCNE4 (left), control (center), or KCNE3 (right). Source data are provided as a Source Data file.

