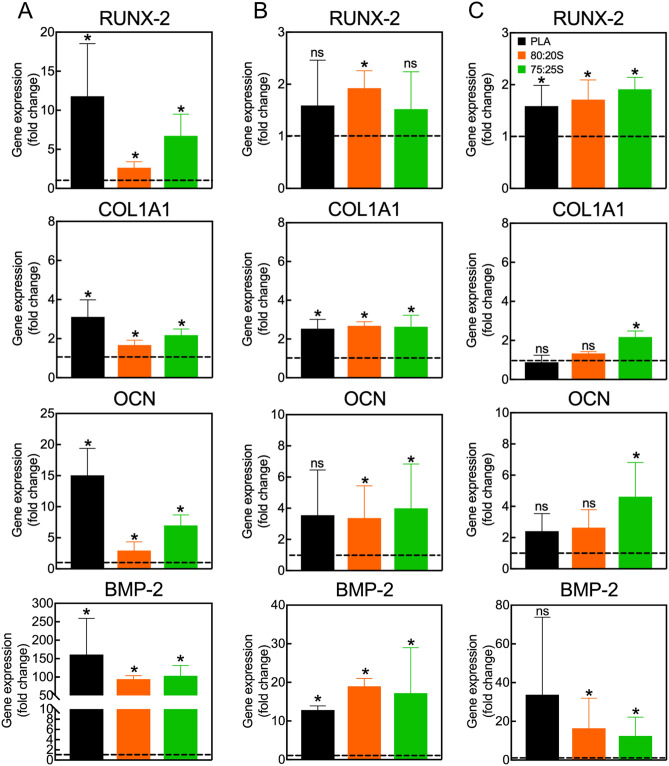
Figure 8.
Quantification of gene expression in MSC cultured on 3D scaffolds under growth conditions for 7, 14 or 21 days (A–C, respectively). Data show the mean ± SD of two independent RT-PCR measurements. All values were normalized to GAPDH expression. Gene expression in control cells cultured on tissue culture dishes without scaffolds was set to one (dashed lines). *p < 0.05, ns non-significant. Please note that the statistical analysis refers to the comparison with the control.

