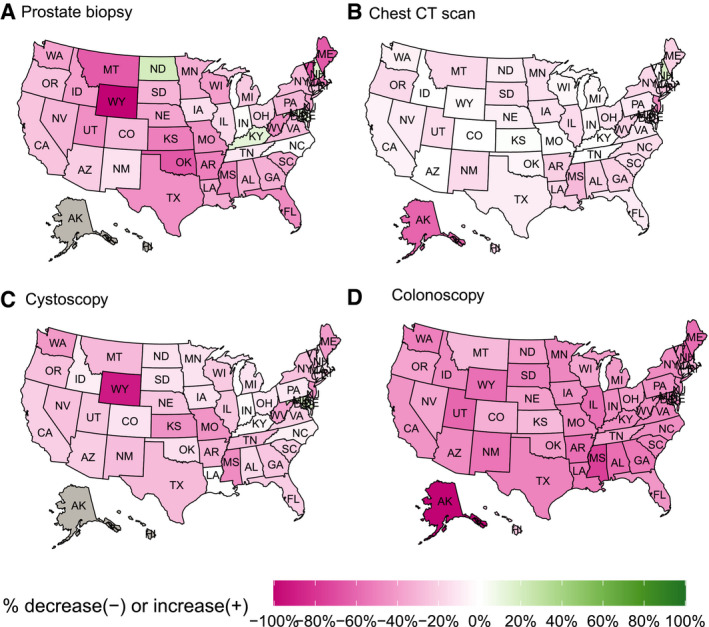
Figure 2.

Heatmap of the change in the number of diagnostic and screening procedures performed for cancer in 2020 compared to 2018 through 2019 baseline in each state for (A) prostate biopsy, (B) chest CT scan, (C) cystoscopy, and (D) colonoscopy. Green states represent a relative increase in procedures performed in 2020, and pink indicates a relative decrease in procedures performed. Gray indicates no data for that state. CT indicates computed tomography (includes both screening and diagnostic).
