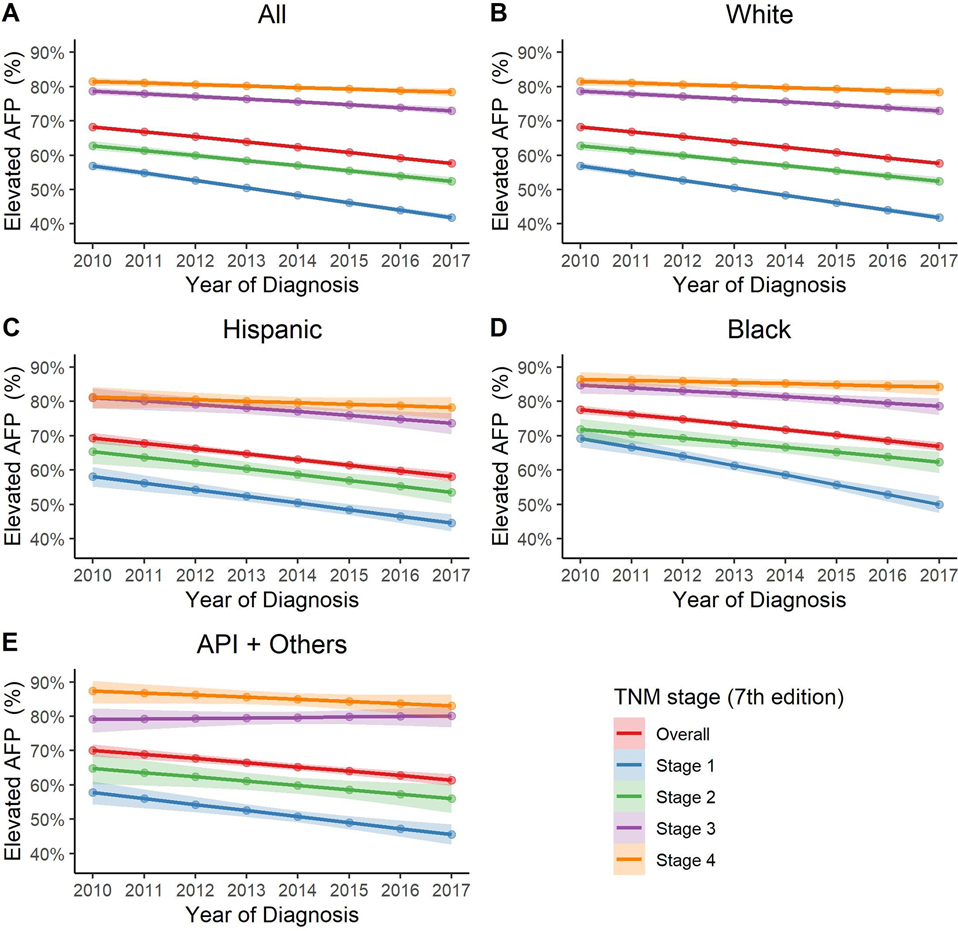
Figure 1: Trend of elevated serum AFP levels at the time of HCC diagnosis, both overall and in race/ethnicity subgroups.
A. Overall.
From 2010 to 2017, there has been a decline in the percentage of HCC tumors with AFP elevation with −6.6% annual change (95% CI: −7.1%, −6.0%). This decline was most significant in early stage tumor: - 8.7% (95% CI: −9.6%, −7.7%), −6.1% (95% CI: −7.3%, −4.8%), −4.5% (95% CI: −5.9, −3.1%), −2.7% (95% CI:−4.3%, −1.1%), annual percent changes in TNM stage 1, 2, 3, 4, respectively (all p < 0.01 for pairwise comparisons between Stage 1 vs. 2, 3, 4, respectively).
B. White
In White, there has been a decline in the percentage of HCC tumors with AFP elevation with −6.2% annual change (95% CI: −6.9%, −5.5%). This decline was most significant in early stage tumor: −8.6% (95% CI: −9.8%, −7.4%), −6.0% (95% CI: −7.6%, −4.5%), −4.1% (95% CI: −5.8%, −2.3%), −2.5% (95% CI: −4.5%, −0.5%), annual percent change in TNM stage 1, 2, 3, 4, respectively (p=0.05 for Stage 1 vs. 2 and all p < 0.01 for pairwise comparisons between Stage 1 vs. 3, 4, respectively).
C. Hispanic
In Hispanic, there has been a decline in the percentage of HCC tumors with AFP elevation with −7.0% annual change (95% CI: −8.6%, −5.5%). Annual percent changes were −7.8% (95% CI: −10.4%, −5.1%), −7.1% (95% CI: −10.5%, −3.7%), −6.1% (95% CI: −10.3%, −2.0%), −2.7% (95% CI: −7.4%, 2.0%), in TNM stage 1, 2, 3, 4, respectively. (p=0.99 for Stage 1 vs. 2, p=0.92 for Stage 1 vs. 3 and p = 0.25 for Stage 1 vs. 4).
D. Black
In Black, there has been a decline in the percentage of HCC tumors with AFP elevation with −7.7% annual change (95% CI: −9.2%, −6.2%). This decline was most significant in early stage tumor: −11.6% (95% CI: −14.2%, −9.0%), −6.2% (95% CI: −9.7%, −2.7%), −5.9% (95% CI: −9.6%, −2.1%), −2.6% (95% CI: −6.9%, 1.7%), annual percent change in TNM stage 1, 2, 3, 4, respectively (p=0.07 for Stage 1 vs. 2, p=0.06 for Stage 1 vs. 3 and p < 0.01 for Stage 1 vs. 4).
E. API and others
In API and others, there has been a decline in the percentage of HCC tumors with AFP elevation with −5.5% annual change (95% CI: −7.4%, −3.6%). Annual percent changes were −7.0% (95% CI: −10.1%, −4.0%), −5.3% (95% CI: −9.6%, −0.9%), 0.9% (95% CI: −3.9%, 5.8%), −4.9% (95% CI: −11.5%, 1.7%) in TNM stage 1, 2, 3, 4, respectively (p=0.92 for Stage 1 vs. 2, p=0.03 for Stage 1 vs. 3 and p = 0.94 for Stage 1 vs. 4).

