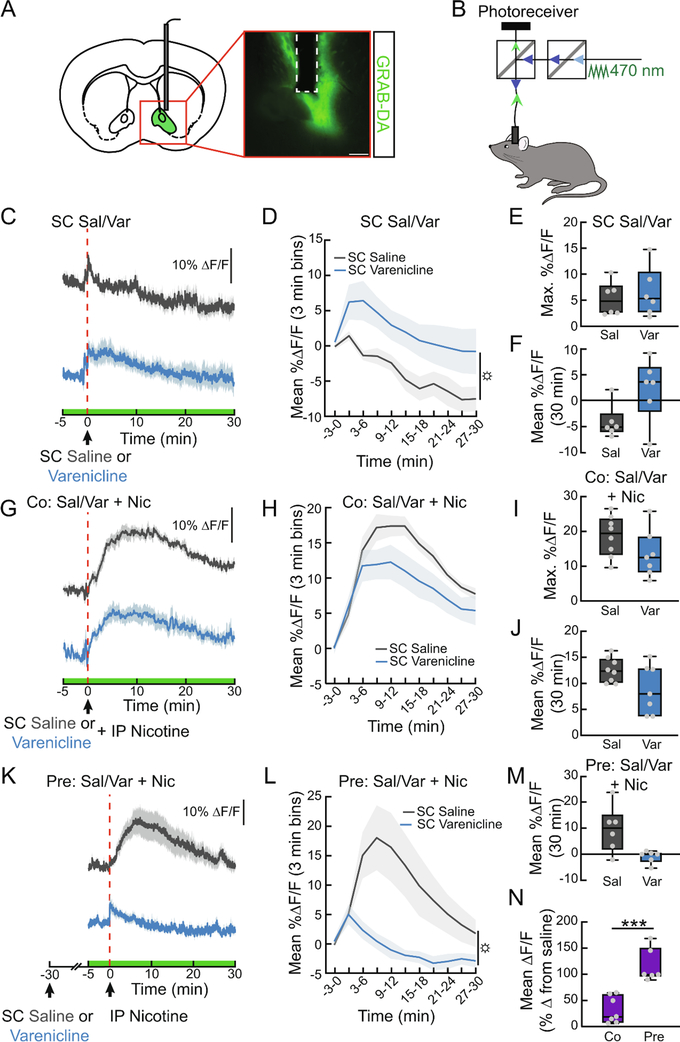
Figure 1. Varenicline attenuates nicotine-evoked DA signaling in the NAc.
(A) Schematic and representative image showing GRAB-DA and fiber placement in the NAc. Scale bar, 200 μm. (B) Schematic showing the fiber photometry system used to monitor DA-induced fluorescent changes in awake, behaving mice. (C) Average ΔF/F of NAc GRAB-DA signals before, during, and following a subcutaneous (SC) injection of varenicline (1.5 mg/kg) or saline (0.9%). Saline was injected intraperitoneally (IP) immediately after SC injections to control for the extra handling in subsequent co-injection experiments. Signals are aligned to the IP injection. Blue, varenicline; grey, saline. Green on timeline represents duration of fiber photometry recording. (D) Mean ΔF/F (3-min bins) of GRAB-DA signals shown in (C) (n=6/group, two-way repeated measures ANOVA, main effect of group: p<0.05). (E) Maximum ΔF/F of the GRAB-DA signal shown in (C) (n=6, paired t-test, ns). (F) 30 min mean ΔF/F of the GRAB-DA signal shown in (C) (n=6, paired t-test, p=0.05). (G) Average ΔF/F of GRAB-DA signals of mice treated with either SC saline or varenicline and co-injected with IP nicotine (1.5 mg/kg). (H) Mean ΔF/F (3 min bins) of GRAB-DA signals shown in (G) (n=7–8/group, two-way repeated measures ANOVA). (I) Maximum ΔF/F of the GRAB-DA signal shown in (G) (n=7–8, unpaired t-test, ns). (J) 30 min mean ΔF/F of the GRAB-DA signal shown in (G) (n=7–8, unpaired t-test, p=0.07). (K) Average ΔF/F of GRAB-DA signals of mice injected with IP nicotine 30 min after a pretreatment with SC varenicline or saline. (L) Mean ΔF/F (3-min bins) of GRAB-DA signals shown in (K) (n=6/group, main effect of group: p<0.05). (M) 30 min mean ΔF/F of the GRAB-DA signal shown in (K) (n=6, paired t-test). (N) Percent suppression of GRAB-DA signal following nicotine injection with co- or pretreatment of varenicline (n=6–7/group, unpaired t-test, p<0.001). For photometry traces and line graphs, dark lines represent means and lighter, shaded areas represent SEM. For box and whisker plots, the box extends from the 25th to 75th percentiles, the line in the box represents the median, and the whiskers extend from the maximum to minimum values. Grey circles represent individual mice. t-tests: ***p<0.001. ANOVA main effect of group: ☼p<0.05. See Table S1 for details on statistical analyses.

