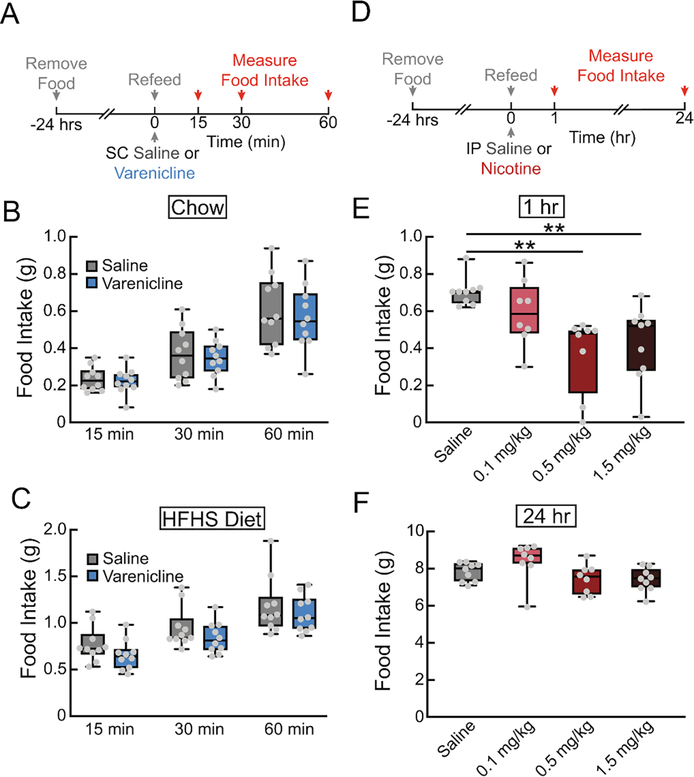
Figure 7. Varenicline, unlike nicotine, does not affect acute food intake in hungry mice.
(A) 24 hr food deprived mice were given SC injections of varenicline (1.5 mg/kg) or saline (0.9%), followed by a pellet of food. Food intake was measured at 15 min, 30 min, and 1 hr. (B) Chow intake following SC injections of varenicline or saline (n=10/group, two-way repeated measures ANOVA, ns). (C) High-fat, high-sugar diet intake following SC injections of varenicline or saline (n=10/group, two-way repeated measures ANOVA, ns). (D) 24 hr food deprived mice were given IP injections of saline or nicotine (0.1, 0.5, 1.5 mg/kg), followed be a pellet of food. Food intake was measured at 1 hr and 24 hr. (E) 1 hr chow intake following IP injections of saline or nicotine (n=8–9/group, one-way ANOVA, p<0.01). (F) 24 hr chow intake following IP injections of saline or nicotine (n=8–9/group, one-way ANOVA, p<0.05). For box and whisker plots, the box extends from the 25th to 75th percentiles, the line in the box represents the median, and the whiskers extend from the maximum to minimum values. Grey circles represent individual mice. post-hoc comparisons: **p<0.01. See Table S1 for details on statistical analyses.

