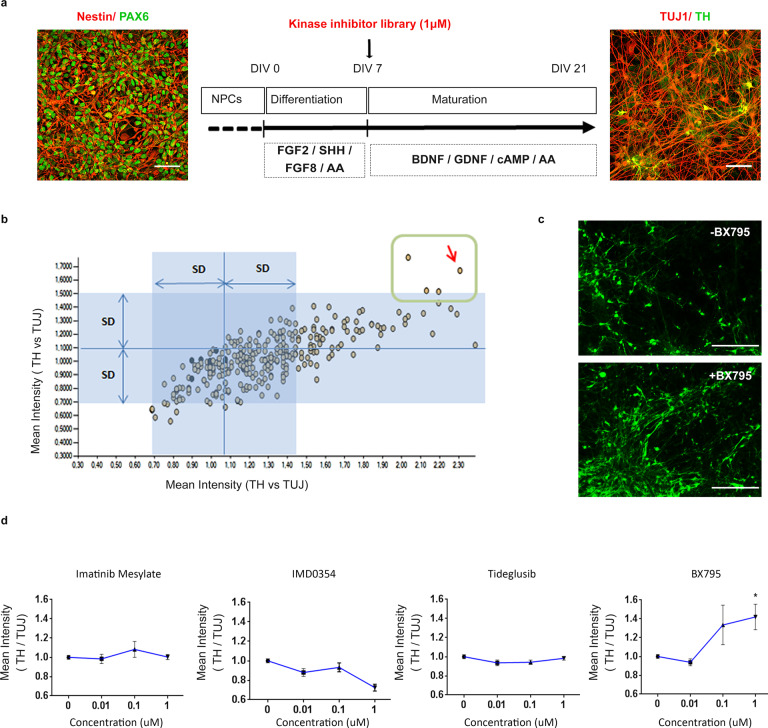
Fig. 1. Identification of BX795 by high content screening of a kinase inhibitor library.
a Directed differentiation of Pax6+ (green)/Nestin+ (red) neural precursor cells (NPCs; DIV 0, left) into TUJ1+ (red)/ TH+ (green) neurons (DIV 21, right). The differentiation protocol and timeline of analysis are shown in the drawing in the middle. FG2 and FGF8, fibroblast growth factors 2 and 8; SHH Sonic Hedgehog, AA ascorbic acid, Scale bar represents BDNF brain-derived neurotrophic factor, GDNF glial cell-derived neurotrophic factor (GDNF), cAMP cyclic AMP. Scale bars, 50 μm. b Scatter plot showing the ratio of TH versus TUJ1 fluorescence intensity in duplicate upon treatment with 273 small molecule kinase inhibitors. The dots inside the green square correspond to the 4 hit compounds showing significant increase of TH versus TUJ1 fluorescence ratio as compared to the DMSO controls (blue dots). The red arrow indicates BX795. c Representative images of patient-derived p.A53T-neurons immunolabelled for TH in 384-well plates. Upper micrograph shows control DMSO-treated cells while lower micrograph represents BX795-treated cells. Scale bar represents 150 μm. d Tests of the four hit compounds in a dose-response format. Data are presented as mean ± SEM. (one-way ANOVA, *P < 0.05, n = 3 independent experiments).

