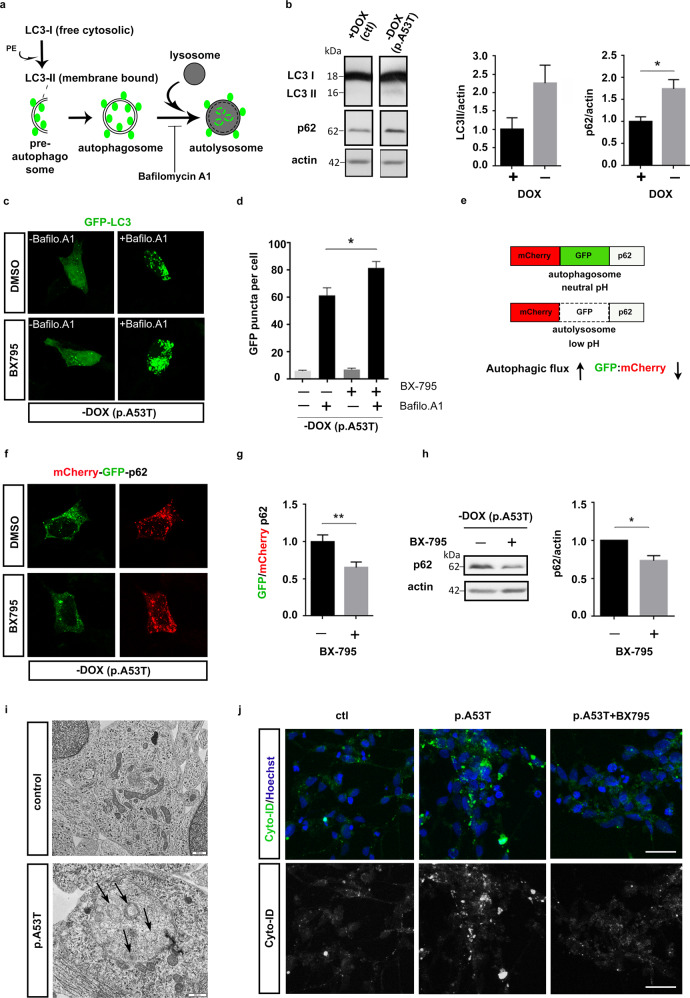
Fig. 9. BX795 facilitates autophagy in an inducible SH-SY5Y cell line expressing human p.A53T-αSyn.
a Schema illustrating that cytosolic LC3 is cleaved to yield LC3-I, which is subsequently conjugated to phosphatidylethanolamine (PE) to form membrane-bound LC3-II (green circles). Pre-autophagosomal structures engulfing protein cargo and organelles destined for degradation close to form double membrane spherical autophagosomes. These fuse with lysosomes to yield autolysosomes and their contents are degraded. Bafilomycin blocks autophagic flux by inhibiting autophagosome-lysosome fusion, which results in accumulation of LC3-II+ autophagosomes. b Representative immunoblot showing steady-state levels of LC3-II and p62 in lysates of inducible SH-SY5Y cells expressing the human p.A53T-αSyn (-Dox) and quantification relative to actin. Data represent mean ± SEM, t est, *P < 0.05, n = 3 independent experiments. c Representative confocal images of individual p.A53T SH-SY5Y cells (-Dox) transfected with GFP-LC3 that were treated or not with bafilomycin A1 in the absence or presence of BX795. d Quantification of GFP-LC3 puncta per cell. Comparisons by ANOVA with Tukey correction. *P < 0.05, n = 72 cells (control DMSO), n = 79 cells (BX795), n = 67 cells (Bafilomycin A1), n = 68 cells BX795 + Bafilomycin A1. Data are representative of three independent experiments). e Assessment of autophagic flux using mCherry-GFP-LC3 color change between autophagosomes and autolysosomes. Autophagic flux is induced when the GFP:mCherry ratio is reduced. f, g. Representative confocal images of individual cells [inducible SH-SY5Y cell line expressing p.A53T-αSyn (-Dox)] transfected with GFP-mCherry-p62 that were treated with DMSO (control) or BX795 and quantification of the ratio of GFP +/mCherry+ puncta (t test, n = 60 (control DMSO), n = 53 (BX795) **P < 0.01 Data are representative of three independent experiments). h Representative immunoblot showing steady-state levels of p62 in cells [inducible SH-SY5Y cell line expressing p.A53T-αSyn (-Dox)] treated or not with BX795, and quantification relative to actin. Data represent mean ± SEM, t test, n = 3 independent experiments. i Representative electron micrographs showing control and patient-derived p.A53T cells. Multilamellar autophagic vacuoles (arrows) are depicted in p.A53T cells; in this case they seem to be engulfed by an additional membranous structure. Scale bar 500 nm. j Representative confocal images showing autophagosome accumulation (brightly labeled green spheroids) in patient-derived p.A53T neurons as compared to either control (ctl) or p.A53T cells treated with BX795. Scale bar, 30 μm.

