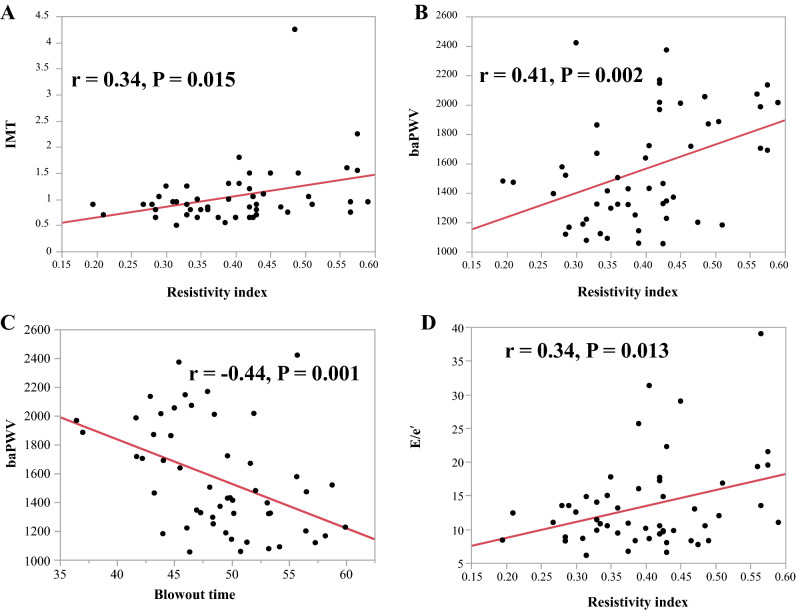
Figure 2.
Correlations between resistivity index and intima-media thickness (IMT) (A), Brachia-ankle pulse-wave velocity (baPWV) (B), and early diastolic velocity to early diastolic myocardial velocity (E/e’) ratio (D). Also shown are the correlations between blowout time and baPWV (C). The mean RI was positively correlated with the mean IMT (r = 0.34, P = 0.015; A), baPWV (r = 0.41, P = 0.002; B) and the E/e’ ratio (r = 0.34, P = 0.013; D). The mean BOT was negatively correlated with the mean baPWV (r = −0.44, P = 0.001; C).

