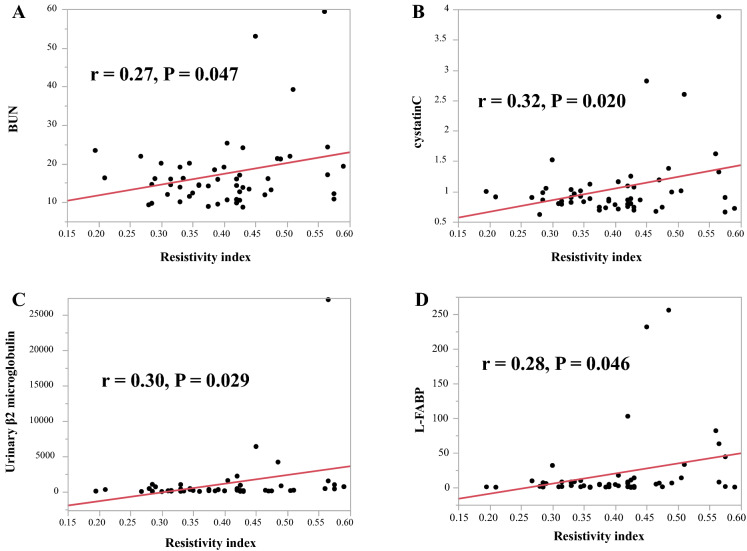
Figure 3.
Correlation between the resistivity index and blood urea nitrogen (BUN) (A), cystatin C (B), Urinary β2 microglobulin (C), and liver-type fatty acid-binding protein (L-FABP) (D). The mean RI was positively correlated with blood urea nitrogen (BUN; r = 0.27, P = 0.047; A), cystatin C (r = 0.32, P = 0.020; B), urinary β2 microglobulin (U-β2MG, r = 0.30, P = 0.029; C), and liver-type fatty acid-binding protein (L-FABP; r = 0.28, P = 0.046; D).

