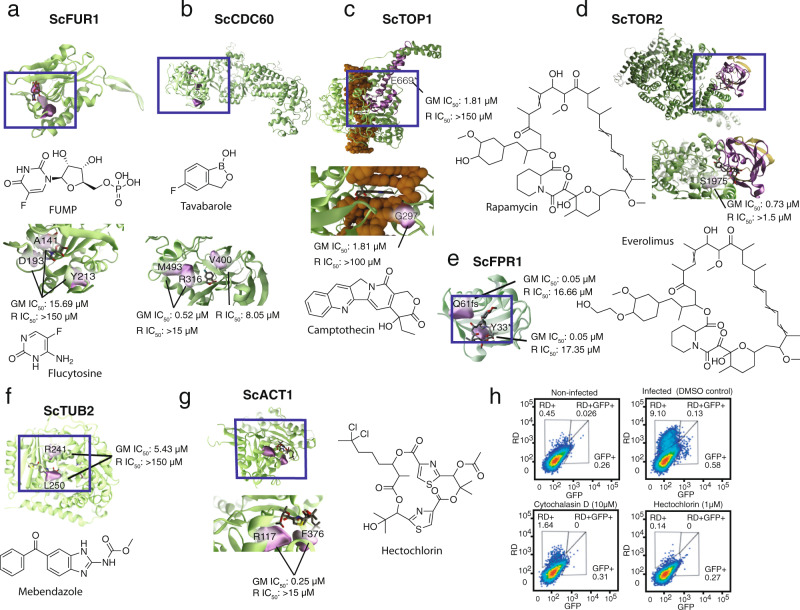
Fig. 4. Resistance-conferring mutations in detail.
Proteins and DNA are shown in green and orange, respectively. R = resistant line, GM = green monster parents. a Fur1 in complex with 5-FUMP. ScFur1 homology model, with a bound 5-FUMP analog (uridine monophosphate) taken from an aligned holo TmFur1 crystal structure (PDB ID: 1O5O). b Cdc60 model. Cdc60 homology model bound to a docked tavaborole molecule. c Top1 model. DNA-Top1-camptothecin complex, modelled using a ScTop1 crystal structure (PDB: 1OIS), with bound camptothecin taken from an aligned holo HsTop1p crystal structure (PDB: 1T8I). d Tor2 model. mTOR-rapamycin-Fpr1 tertiary complex model, modelled using a crystal structure of the human complex as a template (PDB ID: 4DRI107. mTOR residues 1001–2474 are shown in green (homology model), and Fpr1 is shown in yellow (crystal structure, PDB: 1YAT). e Fpr1-rapamycin model. Fpr-rapamycin (crystal structure, PDB 1YAT). f Tub2-nocodazol model. Tub2-nocodazol (crystal structure, PDB: 5CA1). g Act1 model. Act1 (crystal structure, PDB: 1YAG), bound to a docked hectochlorin molecule. Evaluation of hepatocellular traversal by P. berghei sporozoites using an established flow cytometry-based assay108. h Liver cell invasion assay. Flow cytometry plots show traversal and invasion of host cells at 2 h post-invasion by exoerythrocytic forms in Huh7.5.1 cells. The percent of rhodamine-dextran positive single cells (RD) was used to determine overall traversal frequency, controlled against cytochalasin D (positive) at 10 µM and infected untreated conditions, while invasion was evaluated by exclusive GFP + signal.

