
Figure 2.
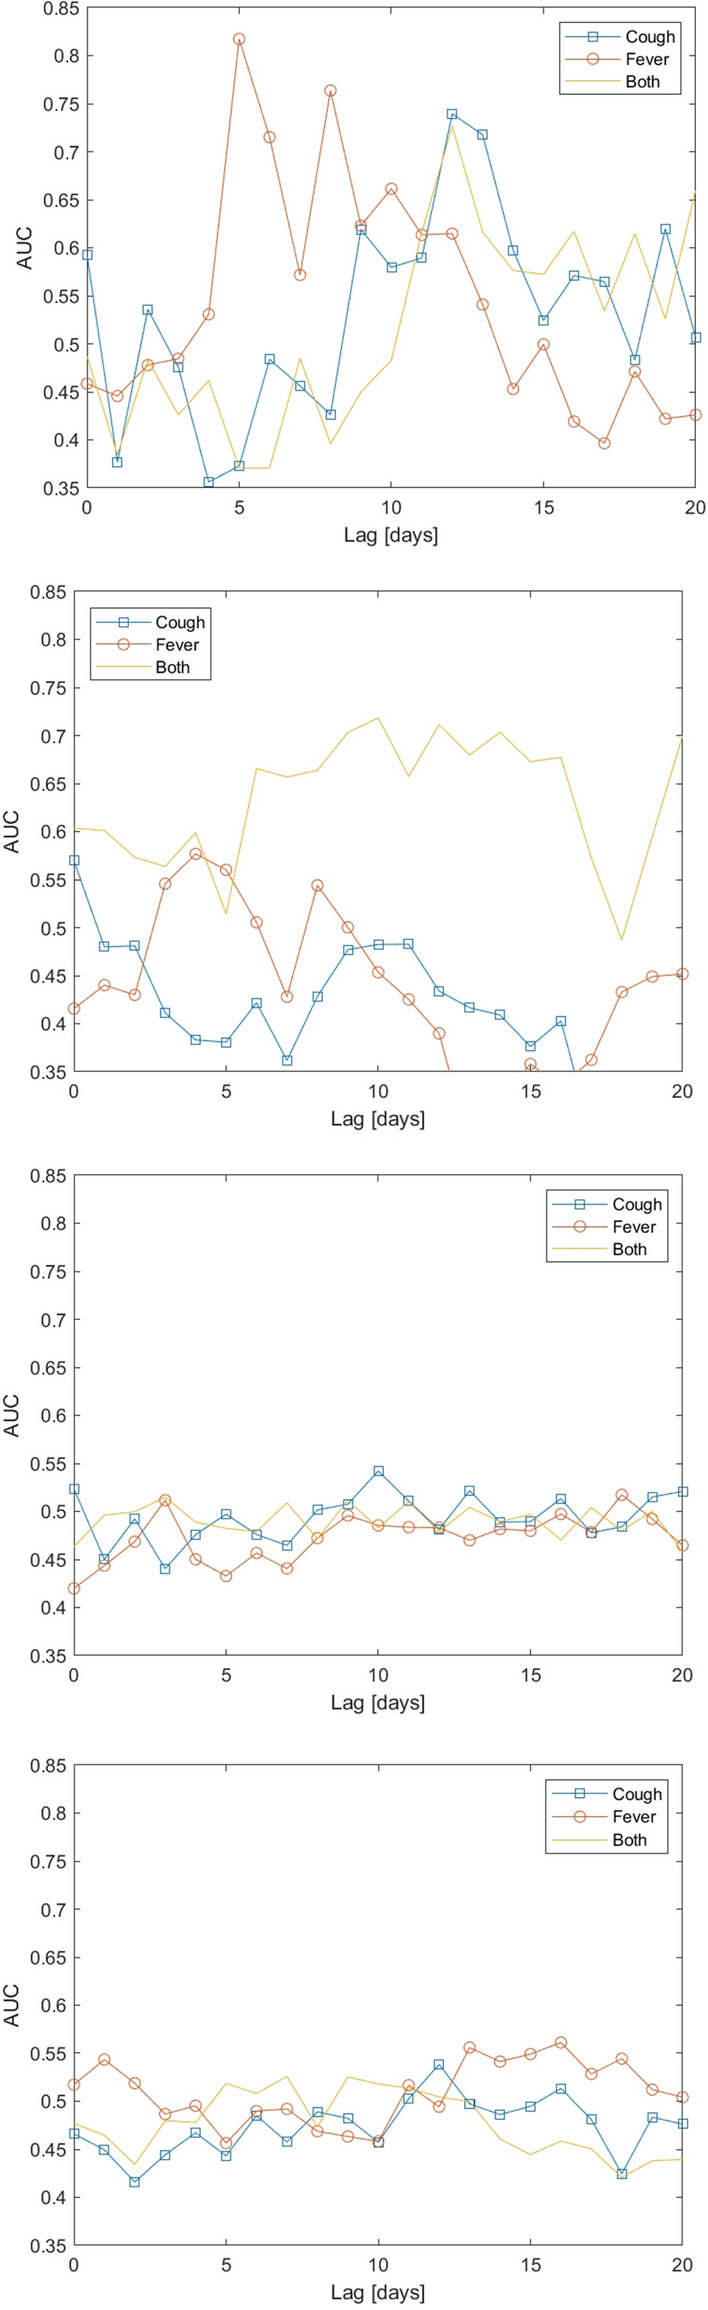
Area Under Curve (AUC) of the UTLA outlier measure for detecting unusually large rises in COVID-19 cases per UTLA, as a function of the lag between case counts and Bing data. The four figures refer to the four time periods: First wave (top) to fourth wave (bottom). Dates of the 4 periods are: (1) March 1st to May 31st. 2020, (2) June 1st to August 31st, 2020, (3) September 1st, 2020 to April 30th, 2021, and (4) May 1st, 2021 to December 13th, 2021. Curves are computed for all weeks and all UTLAs at each time period.