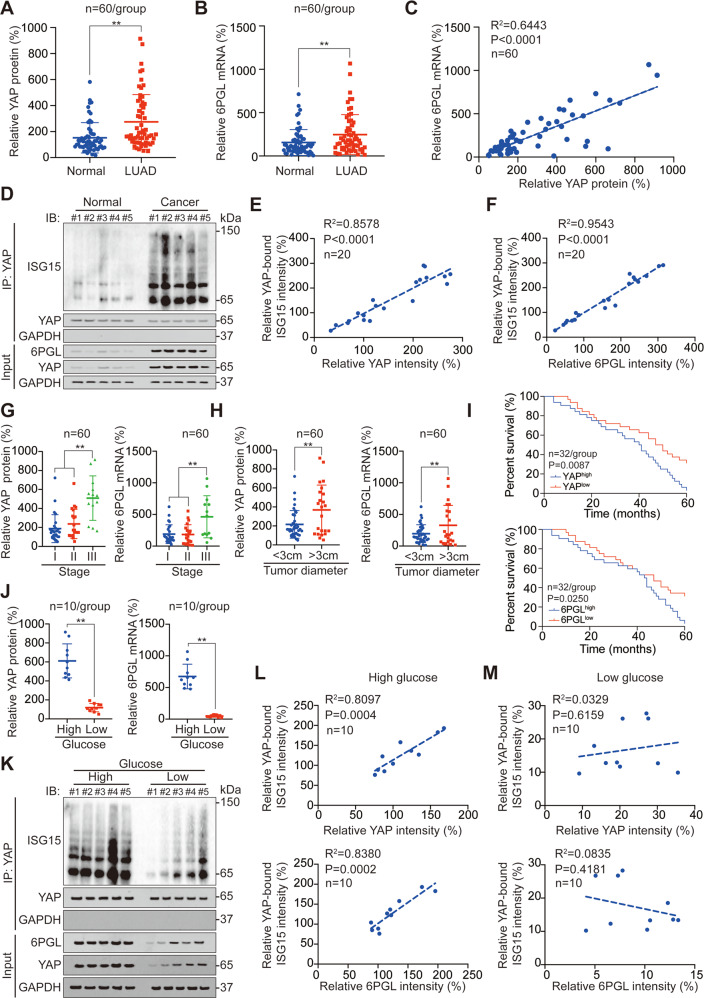
Fig. 7. Clinical association among YAP ISGylation, YAP, and 6PGL.
A YAP protein level in LUAD and adjacent normal tissues as measured by ELISA. B 6PGL mRNA level in LUAD and adjacent normal tissues as measured by qPCR. C Association between YAP protein and 6PGL mRNA level. D Co-IP experiments analyzing YAP ISGylation in LUAD and adjacent normal tissues, and YAP and 6PGL expression in Input sample were analyzed by IB. The YAP level in each co-IP sample was adjusted to the same protein content. E, F Association between YAP bound ISG15 intensity and YAP intensity (E), as well as YAP, bound ISG15 intensity and 6PGL intensity (F) in LUAD tissues. G, H YAP protein and 6PGL mRNA level in stage I–III LUAD samples (G), <3 cm and >3 cm diameter LUAD samples (H). I Survival analysis for LUAD patients with high or low YAP protein and 6PGL mRNA level. J YAP protein and 6PGL mRNA level in high and low glucose LUAD samples. K Co-IP experiments analyzing YAP ISGylation in high and low glucose LUAD tissues, and YAP and 6PGL expression in Input sample were analyzed by IB. The YAP level in each co-IP samples was adjusted to the same protein content. L, M Association between YAP bound ISG15 intensity and YAP intensity, as well as YAP, bound ISG15 intensity and 6PGL intensity in high (L) or low (M) glucose LUAD tissues. The data are shown as the mean ± SD from three biological replicates (including IB). Data in A, B, H, I were analyzed using a student’s t test. Data in C, E, F, L, M were analyzed using the Spearman rank correlation analysis. Data in G were analyzed using a one-way ANOVA test. Data in I were analyzed using a log-rank test. **P < 0.01.

