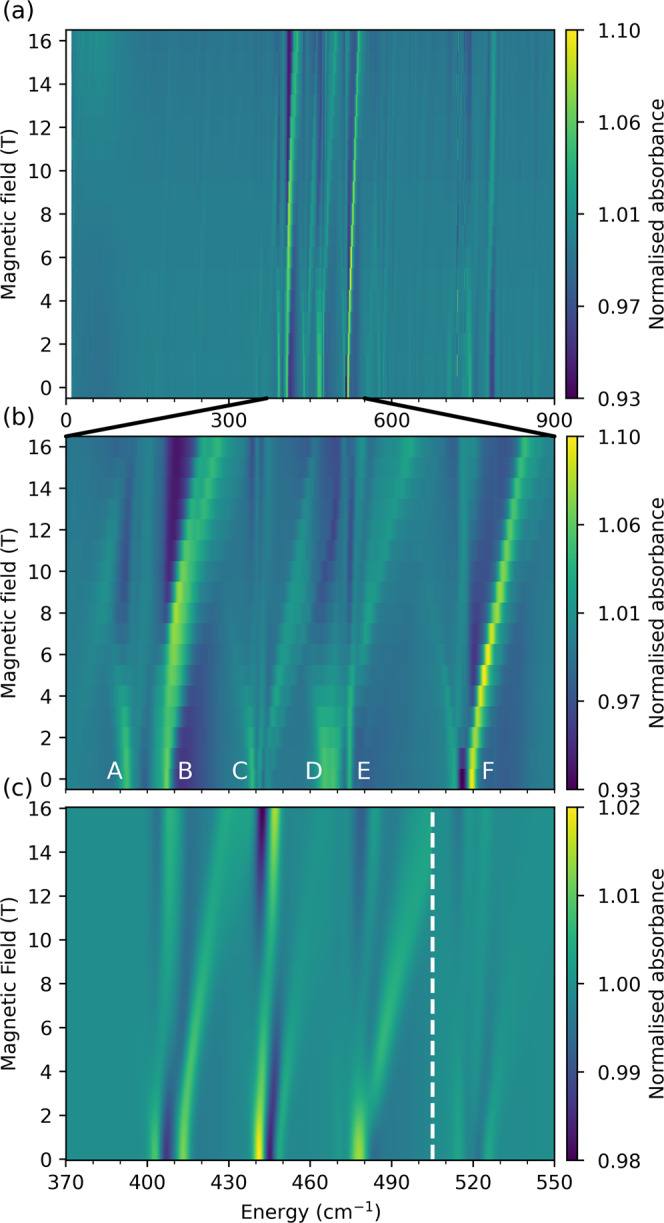
Fig. 3. Experimental and simulated FIRMS maps for 1.

Experimental FIRMS map measured at 4.2 K in the range a 0–900 cm−1 and b 370–550 cm−1 (field dependent signals are labelled as A–F). c Composite ab initio simulated FIRMS map for signals A–F using CASPT2-SO equilibrium CF parameters with experimental CF energies, CASSCF-SO vibronic couplings and ab initio transition intensities where the vibrational transition probabilities have been scaled according to Fig. S3, and the electronic transition probabilities have been scaled by 20 times (see text). This composite image was generated from two independent simulations including vibrational modes 34–42 and 43–45 (Figs. S14 and S15); the vertical dashed line indicates where the two data sets are joined. The colour bars show fractional changes in relative transmittance (normalised absorbance) due to the magnetic field.
