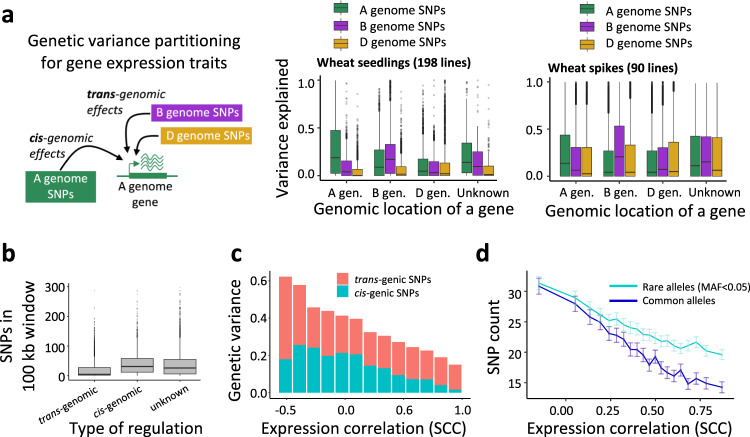
Fig. 2. Partitioning variance in homoeolog expression using SNPs from different parts of the wheat genomes.
a An example of genetic variance partitioning for a gene located in the A genome using SNPs from the same genome (cis-genomic SNPs) or other homoeologous genomes (trans-genomic SNPs). As shown in the seedling panel, for genes in the A genome, variance explained by cis-genomic SNPs was 3.1 and 5.7 times higher than that explained by the B and D genomes’ trans-genomic SNPs, respectively. Expression variance in the B genome was better explained by the B genome SNPs, which explained 1.3 and 3.4 times more variance than the SNPs from the A and D genomes, respectively. The variance explained by the cis-genomic SNPs from the D genome was comparable to that explained by the trans-genomic SNPs from the A and B genomes. Top 10,000 genes showing the highest expression variance were used in the analyses. b A 52.2% reduction in the mean SNP diversity (two-sided Mann–Whitney test W = 142,90,644, p-value < 2.2 × 10⁻¹⁶) was observed near 6173 genes with the expression variance mostly explained by trans-genomic SNPs, compared to 2852 genes with the expression variance explained predominantly by the cis-genomic SNPs. In (a) and (b), box shows the median and interquartile ranges (IQR). The end of the top line is the maximum or the third quartile (Q) + 1.5 × IQR. The end of the bottom line denotes either the minimum or the first Q − 1.5 × IQR. The dots are more or less than Q ± 1.5 × IQR. c The relationship between the proportion of genetic variance explained by cis- and trans-genic SNPs calculated for individual homoeologs and the levels of expression correlation (SCC) between the pairs of homoeologs in the wheat panel. The mean of genetic variance was calculated for data binned based on the SCC values. d The counts of rare and common SNPs in the genic regions of the 21,809 pair-wise combinations of homoeologs (gene body ± 10 kb) showing different levels of expression correlation. The mean and standard error of SNP counts were calculated for data binned based on the ranked SCC values. Source data are provided as a Source Data file.

