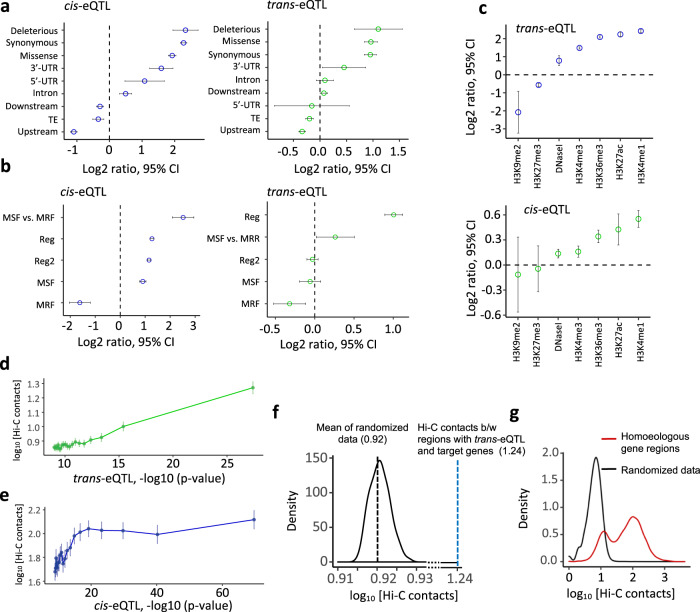
Fig. 3. Functional annotation of eQTL.
The x-axis represents eQTL enrichment expressed as the log2 of the proportion of eQTL within specific classes of SNP variants (y-axis) relative to the proportion of eQTL within the random samples of SNPs. All analyses of enrichment and Hi-C contacts are based on 2,021,936 SNPs, 14,645 trans-eQTL and 8568 cis-eQTL. a Mean enrichment of cis-eQTL and trans-eQTL among SNP variants from different functional classes defined based on gene and transposable element (TE) annotation (N = 2,021,936 SNP sites). b Mean enrichment of cis-eQTL and trans-eQTL in the MNase Sensitive Footprints (MSF), MNase Resistant Footprints (MRF), and regulatory regions identified based on the sensitivity to DNase I treatment, epigenetic variation, and open chromatin marks. Enrichment was assessed relative to genome-wide patterns, except for MSF vs MRF, where enrichment was tested for eQTL located within MSF relative to MRF. ‘Reg’ region corresponds to regulatory elements, as defined in Li et al.27. ‘Reg2’ corresponds to regions classified as states 5–7 in the same study. c Mean enrichment of cis-eQTL and trans-eQTL in the epigenetically marked regions. d Relationship between the binned trans-eQTL p-values and frequency of Hi-C contacts between regions harboring a trans-eQTL and its target gene. Data are presented as mean values ± SEM. e Relationship between the binned distal (>2 Mbp) cis-eQTL-target gene p-values and frequency of Hi-C contacts between regions harboring a cis-eQTL and its target gene. Data are presented as mean values ± SEM. f Comparison of Hi-C contacts (log10-transformed) between regions harboring trans-eQTL-target gene pairs to Hi-C contacts between a random set of genes (two-sided Wilcoxon rank-sum test, W = 191,789,322, p-value = 8.8e−16). g Comparison of Hi-C contacts (log10-transformed) between the pairs of homoeologs and random pairs of genes.

