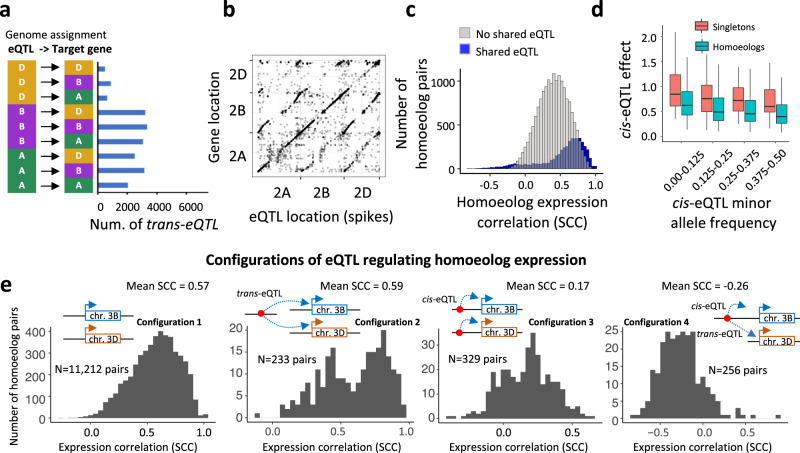
Fig. 4. Effects of cis- and trans-eQTL identified in wheat seedlings and spikes on homoeologous gene expression.
a The total number of trans-eQTL targeting genes located either in the same genome (A → A, B → B, D → D) or in different genomes (A → B, A → D, B → A, B → D, D → A, D → B). b Location of eQTL relative to positions of target genes on wheat chromosomes 2A, 2B, and 2D in wheat spikes. c. Distribution of Spearman Correlation Coefficient (SCC) estimated for the pairs of homoeologs that either share at least one eQTL or do not share any eQTL. d The relationship between cis-eQTL minor allele frequency and effect size (absolute values) for two groups of genes, homoeologs, and singletons. Box shows the median and interquartile ranges (IQR). The end of the top line is the maximum or the third quartile (Q) + 1.5 × IQR. The end of the bottom line denotes either the minimum or the first Q − 1.5 × IQR. e Distribution of expression correlation values between the pairs of homoeologs for various eQTL - target gene configurations. A pair of homoeologs from chromosomes 3B and 3D was used to illustrate locations of cis- and trans-eQTL relative to their target genes. Source data are provided as a Source Data file.

