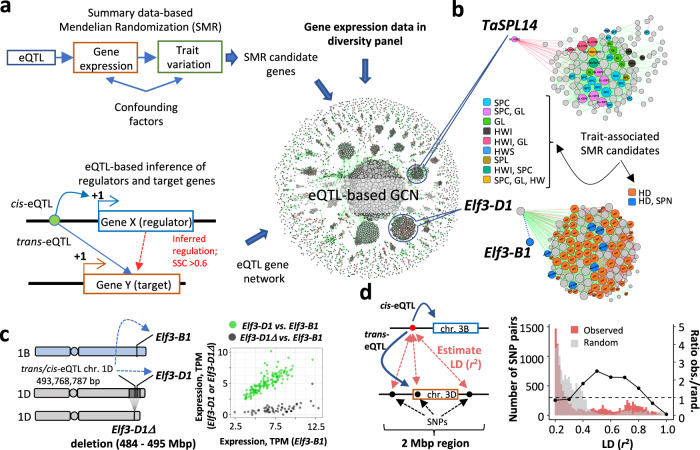
Fig. 5. Joint eQTL and GWAS analysis of agronomic traits in wheat.
a Outline of the strategy used to integrate eQTL and GWAS data to investigate the genetic basis of yield component and development trait variation in wheat (see “Methods”). We used field-based phenotyping data collected for a diverse panel of ~800 wheat accessions from the 1000 wheat exomes project8 including grain filling period (GFP), harvest weight (HW), drought susceptibility index for harvest weight (HWS), heading date (HD) and plant height (PHT) traits. A set of phenotypic traits was collected for a diverse panel of 400 wheat accessions: grain length (GL), grain width (GW), thousand-grain weight (TGW), grain area (GRA), spike compactness (SPC), spikelet number per spike (SPN), awnedness (AWN), and height (PHT) (Supplementary Data 10). b Gene co-expression network (GCN) modules, including TaSPL14 and Elf3 genes, are enriched for genes associated with agronomic traits in SMR analyses. c eQTL located on chr. 1D acts as a cis-variant for Elf3-D1:TraesCS1D01G451200 (GWAS FDR-corrected p-value = 4e−54) and is tightly linked (r2 > 0.8) with variants acting as trans-variants for Elf3-B1:TraesCS1B01G477400 (GWAS FDR-corrected p-value = 9e−10). A deletion of Elf3-D1 (Elf3-D1Δ locus) in wheat affects both HD and SPN traits. d. Distribution of LD between negatively correlated homoeologs compared to LD between the random set of homoeolog pairs. LD was measured between the cis/trans-eQTL in one homoeologue and SNPs within a 2-Mb window, including another homoeologue. Only LD values above r2 > 0.2 were plotted. The right y-axis shows the ratio of SNP pairs within different LD ranges (the dotted line shows a ratio of 1.0) estimated for the negatively correlated and random pairs of homoeologs. Source data are provided as a Source Data file.

