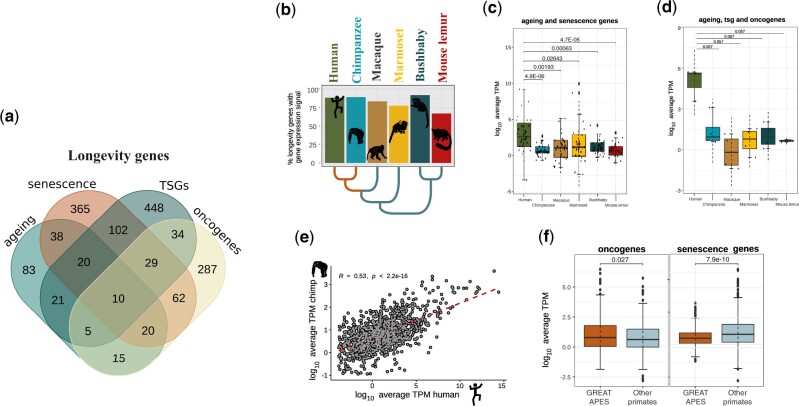
Fig. 4.
Evolution of longevity GE in the primate liver. (a) Venn diagram representing the total number of orthologous longevity genes (1,539) shared by at least one species in each of main primate lineages, broken down based on the different categories (tumor suppressors, oncogenes, CS and ageing genes). The genes were divided into categories: ageing, senescence-related genes, tumor suppressor genes (TSGs), and oncogenes. (b) Expression levels for the 1,539 genes in the liver were comparable across primates. (c) Expression levels for ageing-related genes and senescence genes. (d) Expression levels for ageing-related genes, tumor suppressors, and oncogenes. In both groups (c, d), humans display higher expression compared with other primates (Wilcoxon’s rank-sum test). (e) The expression of the 1,539 longevity genes in the liver is positively correlated between humans and chimpanzee (Spearman’s correlation coefficient, R = 0.53, P < 0.001). (f) Oncogenes are significantly more expressed in great apes compared with other primates. Senescence genes are significantly less expressed in great apes relative to the other primates (Wilcoxon’s rank-sum test, P < 0.05).

