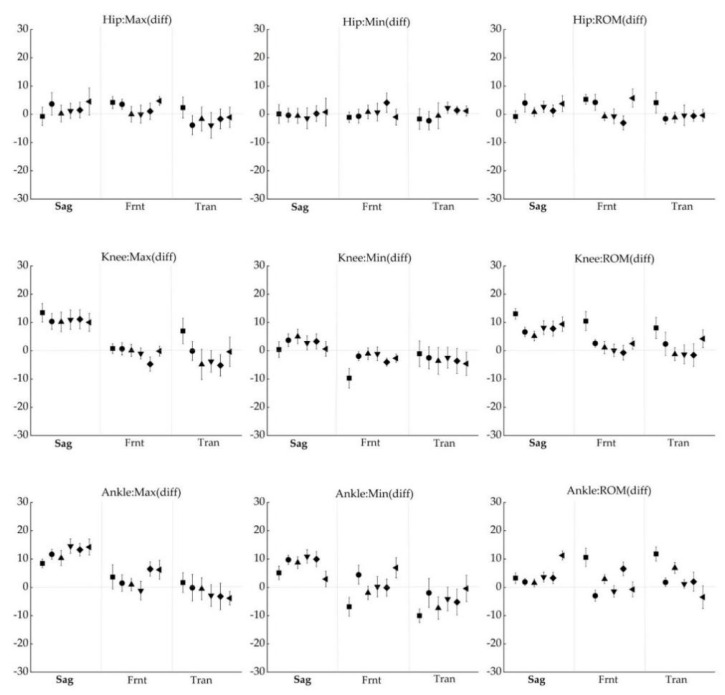
Figure 7.
Difference between IMU suit and OptiTrack system in minimum angle (left row), maximum angle (center row), range of motion (right row). The six data points of each plane correspond to the GA (■), SQ (●), SLS (▲), FL (▼), SL (◆), and CMJ (◀). Positive numbers showed that the angle calculated by the Perception Neuron® system was larger than the angle computed by the OptiTrack system. The error bars represent the 95% confidence interval of the difference.

